UAV Systems Engineering · Module 8
M8-T8: Fault-tree analysis
A fault tree turns “how could this go wrong?” into a list of minimal combinations of failures, so single points of failure and common causes cannot hide.
FMEA starts from components and asks what each failure does. Fault tree analysis starts from a hazard and asks what combinations of failures could cause it. The two views meet in the minimal cut sets: the smallest groups of events that together cause the top event. Any cut set of size one is a single point of failure.
Learning objectives
After this lesson, you should be able to:
- Build a fault tree with AND and OR gates from a top-level hazard.
- Compute minimal cut sets and identify single points of failure and common causes.
- Roll up probabilities under independence and discuss when that assumption fails.
- Use the results to drive design changes and verification.
Conceptual explanation
Established Fault tree analysis is standardised (IEC 61025) and described in the Fault Tree Handbook (NUREG-0492). Probabilities in the example are placeholders to show the arithmetic, not failure rates of real components; real rates need data and a defined exposure time.
A fault tree is a Boolean model: the top event (a hazard, for example “loss of position estimate”) is decomposed through gates into basic events. An OR gate occurs if any input occurs; an AND gate only if all inputs occur. A cut set is a set of basic events whose joint occurrence causes the top event; a minimal cut set contains no smaller cut set. The order (size) of the minimal cut sets is the key result:
- Order 1: a single point of failure; the top event follows from one basic event.
- Order 2 and higher: redundancy exists, but if the events share a cause the true protection is lower than the tree suggests.
- Common cause: one event that appears in several branches (power, a shared clock, a shared software library, the same environmental condition) must appear once in the tree and then shows up in a small cut set.
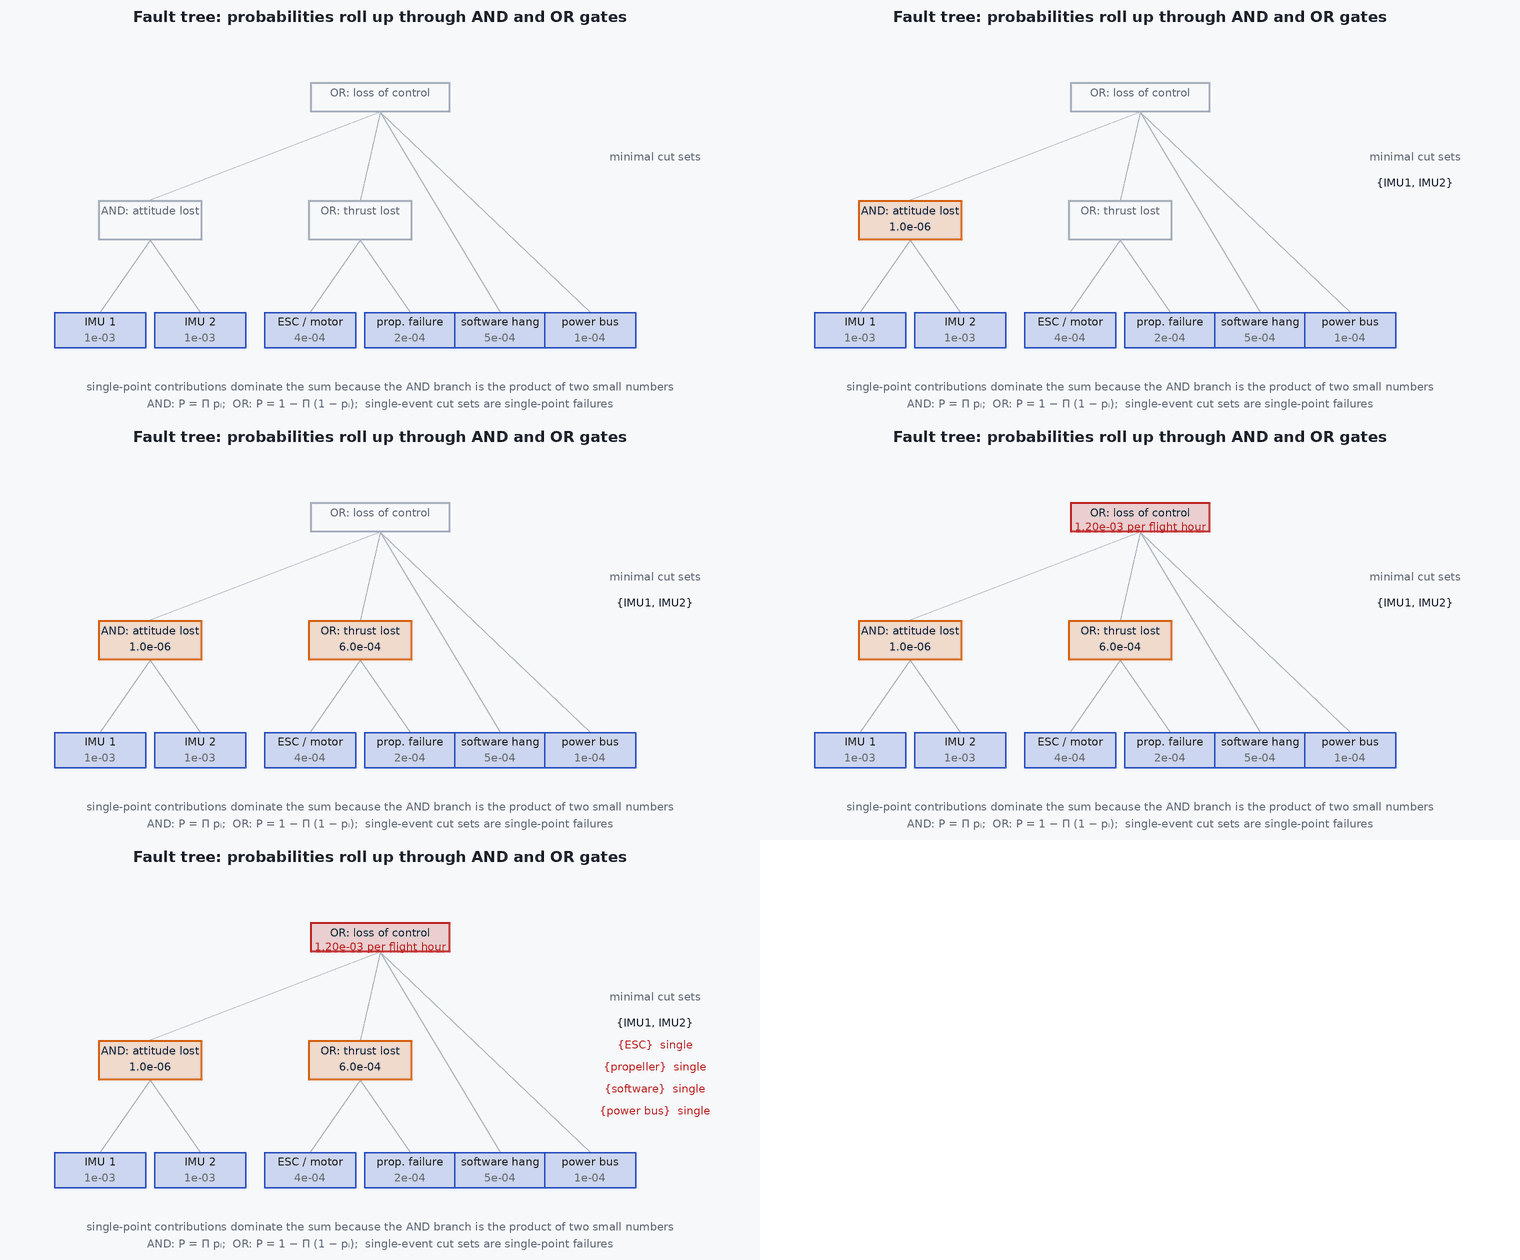
Engineering intuition
The picture shows the classic trap. GNSS and vision are two independent ways to know position, so losing both needs two failures. But both run from the same power rail, so one event (power) removes both and the “AND” is only an AND on paper. The cut-set computation finds that automatically: power appears in a cut set by itself.
Fault trees also expose the environmental coupling that is common in navigation: a featureless corridor degrades vision; a tunnel or jamming degrades GNSS; a place that has both problems (an indoor warehouse with dark racks, near a jammer) turns an OR-of-separate-events into one correlated situation. Model those conditions as events with explicit probabilities and note the correlation.
Mathematical formulation
For independent basic events with probabilities the top-event probability follows from the cut sets using inclusion-exclusion; the common rare-event approximation sums the cut-set probabilities:
Exact for independent events by inclusion-exclusion over cut sets (or by Boolean algebra on the tree). The approximation is an upper bound and good for small probabilities. For a gate with independent inputs: OR gives , AND gives . The Fussell-Vesely importance of a basic event is the fraction of the top-event probability contributed by cut sets containing it, (top), which ranks where improvement pays most. Probabilities must be stated per a defined exposure time (per flight or per hour), and independence must be defended; a -factor model, , represents a fraction of each channel’s failures as common.
- a minimal cut set.
- probability of basic event over the exposure time.
- common-cause fraction.
Architecture and data flow
FMEA failure modes and hazard analysis → top events → fault tree (structured file: events, gates, probabilities with sources and exposure time) → minimal cut sets and probability roll-up by script → design actions for order-1 and order-2 sets with a shared cause → updated tree → verification tests per cut set (fault injection of each single point of failure, of the AND combinations that are credible) → traceability matrix.
Real-world UAV applications
- Showing that no single failure removes the position estimate.
- Finding hidden common causes in redundant sensing.
- Prioritising mitigations by importance.
- Supporting the safety case for a GNSS-denied operation.
Implementation example
This runs as shown. A minimal-cut-set solver (the MOCUS algorithm) and a probability roll-up for the tree of the figure. Probabilities are placeholders per flight; the point is the structure, the single point of failure found, and the effect of a separate power rail.
import itertools

def mocus(tree, top):
    # tree: gate name -> ('AND'|'OR', [children]); anything not in tree is a basic event
    cuts = [frozenset([top])]
    changed = True
    while changed:
        changed = False; new = []
        for c in cuts:
            g = next((x for x in c if x in tree), None)
            if g is None: new.append(c); continue
            changed = True; kind, kids = tree[g]; rest = c - {g}
            if kind == 'AND': new.append(frozenset(rest | set(kids)))
            else: new.extend(frozenset(rest | {k}) for k in kids)
        cuts = new
    cuts = set(cuts); minimal = [c for c in cuts if not any(o < c for o in cuts)]
    return sorted(minimal, key=lambda c: (len(c), sorted(c)))
def p_top(cuts, p):                                       # exact for independent basic events, by inclusion-exclusion over the cut sets
    total = 0.0
    for r in range(1, len(cuts) + 1):
        for comb in itertools.combinations(cuts, r):
            ev = frozenset().union(*comb); pr = 1.0
            for e in ev: pr *= p[e]
            total += (-1) ** (r + 1) * pr
    return total
tree = {'TOP': ('AND', ['GNSS_lost', 'Vision_lost']), 'GNSS_lost': ('OR', ['jamming', 'antenna', 'receiver', 'power']),
        'Vision_lost': ('OR', ['camera', 'scene', 'power'])}
p = {'jamming': 1e-3, 'antenna': 1e-4, 'receiver': 1e-4, 'camera': 2e-4, 'scene': 5e-3, 'power': 1e-5}          # PLACEHOLDERS per flight
cuts = mocus(tree, 'TOP')
print("minimal cut sets:", [sorted(c) for c in cuts])
print(f"single points of failure: {[sorted(c) for c in cuts if len(c) == 1]};  P(top) = {p_top(cuts, p):.3e};  rare-event sum = {sum(__import__('math').prod(p[e] for e in c) for c in cuts):.3e}")
assert [sorted(c) for c in cuts if len(c) == 1] == [['power']]
tree2 = {'TOP': ('AND', ['GNSS_lost', 'Vision_lost']), 'GNSS_lost': ('OR', ['jamming', 'antenna', 'receiver', 'power_a']), 'Vision_lost': ('OR', ['camera', 'scene', 'power_b'])}
p2 = dict(p, power_a=1e-5, power_b=1e-5); cuts2 = mocus(tree2, 'TOP')
print(f"with separate rails: single points {[sorted(c) for c in cuts2 if len(c) == 1]}, P(top) = {p_top(cuts2, p2):.3e}")
assert not [c for c in cuts2 if len(c) == 1] and p_top(cuts2, p2) < p_top(cuts, p) / 2
fv = {e: sum(__import__('math').prod(p[x] for x in c) for c in cuts if e in c) / p_top(cuts, p) for e in p}
print("Fussell-Vesely importance:", {k: round(v, 2) for k, v in sorted(fv.items(), key=lambda kv: -kv[1])[:3]})Common engineering mistakes
Drawing redundancy without checking shared causes
Common power, clocks, software, environment turn ANDs into single points.
Probabilities without an exposure time
A number per hour and a number per flight cannot be combined.
Assuming independence silently
Defend it or use a common-cause model.
Stopping at the tree
Every minimal cut set of order 1 or 2 should map to a design action or a verification test.
Putting software faults in as random failures
Systematic faults need a different argument (verification and process), not a failure rate.
Failure modes
| Failure mode | How it shows up | Likely cause |
|---|---|---|
| Hidden single point of failure | One fault removes a supposedly redundant function | Common cause not modelled |
| Overly optimistic result | Real failures more frequent than predicted | Independence assumed; correlated environment |
| Tree out of date | Design changed, tree did not | No change control linking the two |
| Unverified cut sets | Claimed redundancy never tested | No fault injection for credible combinations |
Debugging approach
- List all events that appear in more than one branch and check each for common cause.
- Check the exposure time and units of each probability.
- Compare the tree with the FMEA for missing failure modes.
- Inject each single point of failure in HIL or on the ground and record the outcome.
Practical exercises
- Add “shared clock” as a common cause of both camera and IMU timestamp validity and recompute the cut sets.
- Compute the Fussell-Vesely importance of each event in the example.
- Add a -factor of 5 % to the two independent power rails and compute the effect.
- Build a fault tree for “vehicle lands outside the planned zone”.
Interview questions
Write an answer in your own words, then reveal the model answer. Nothing is sent anywhere.
Question 1
What is a minimal cut set and why does its order matter?
Model answer
It is a smallest combination of basic events that causes the top event; order-1 sets are single points of failure and low-order sets show where redundancy is thin.
Question 2
How does a fault tree reveal common-cause failures?
Model answer
A basic event that feeds several branches (shared power, clock, software) appears alone or in small cut sets once the tree is solved, showing that the apparent redundancy is defeated by one event.
Question 3
What does the rare-event approximation do?
Model answer
It approximates the top-event probability by the sum of cut-set probabilities, an upper bound that is accurate when basic-event probabilities are small.
References and further reading
Primary papers, official documentation and standards. Each claim above that is specific to a tool or version points here.