UAV Systems Engineering · Module 7
M7-T12: Compute and memory budgets
A budget is a table of measurements and margins. Without one you discover your limits in flight.
Onboard compute is finite and shared. A compute and memory budget makes it explicit: what each function needs in each mission mode, what is available, and how much margin remains. It is also the earliest warning that a new feature does not fit.
Learning objectives
After this lesson, you should be able to:
- Build a per-mode budget of CPU, GPU, memory and bus bandwidth from measurements.
- Aggregate with the right statistic: sums of means are not sums of worst cases.
- Set and justify headroom margins.
- Automate the budget check so that a change that breaks it fails a review.
Conceptual explanation
Established Budgeting practice is standard systems engineering. The numbers in this lesson are placeholders for illustration; every real budget entry must cite a measurement on the target hardware with a stated workload.
A budget has four ingredients:
- A function list per mission mode (take-off, cruise with mapping, loiter with inspection, degraded navigation, landing). Different modes run different sets; the budget is the maximum over modes, not the average.
- Resources: CPU (cores, utilisation), GPU, memory (resident set, peak), storage write rate, bus and network bandwidth, power.
- Measurements: for each function and resource, a distribution, measured on the target hardware under representative load; keep the mean, a high percentile (p95 or p99) and the maximum.
- Margin policy: the headroom that must remain, based on how bad overrun is (a perception dropout may tolerate 20 %; a hard-real-time loop usually needs 40 % or more) and how uncertain the measurements are.
Engineering intuition
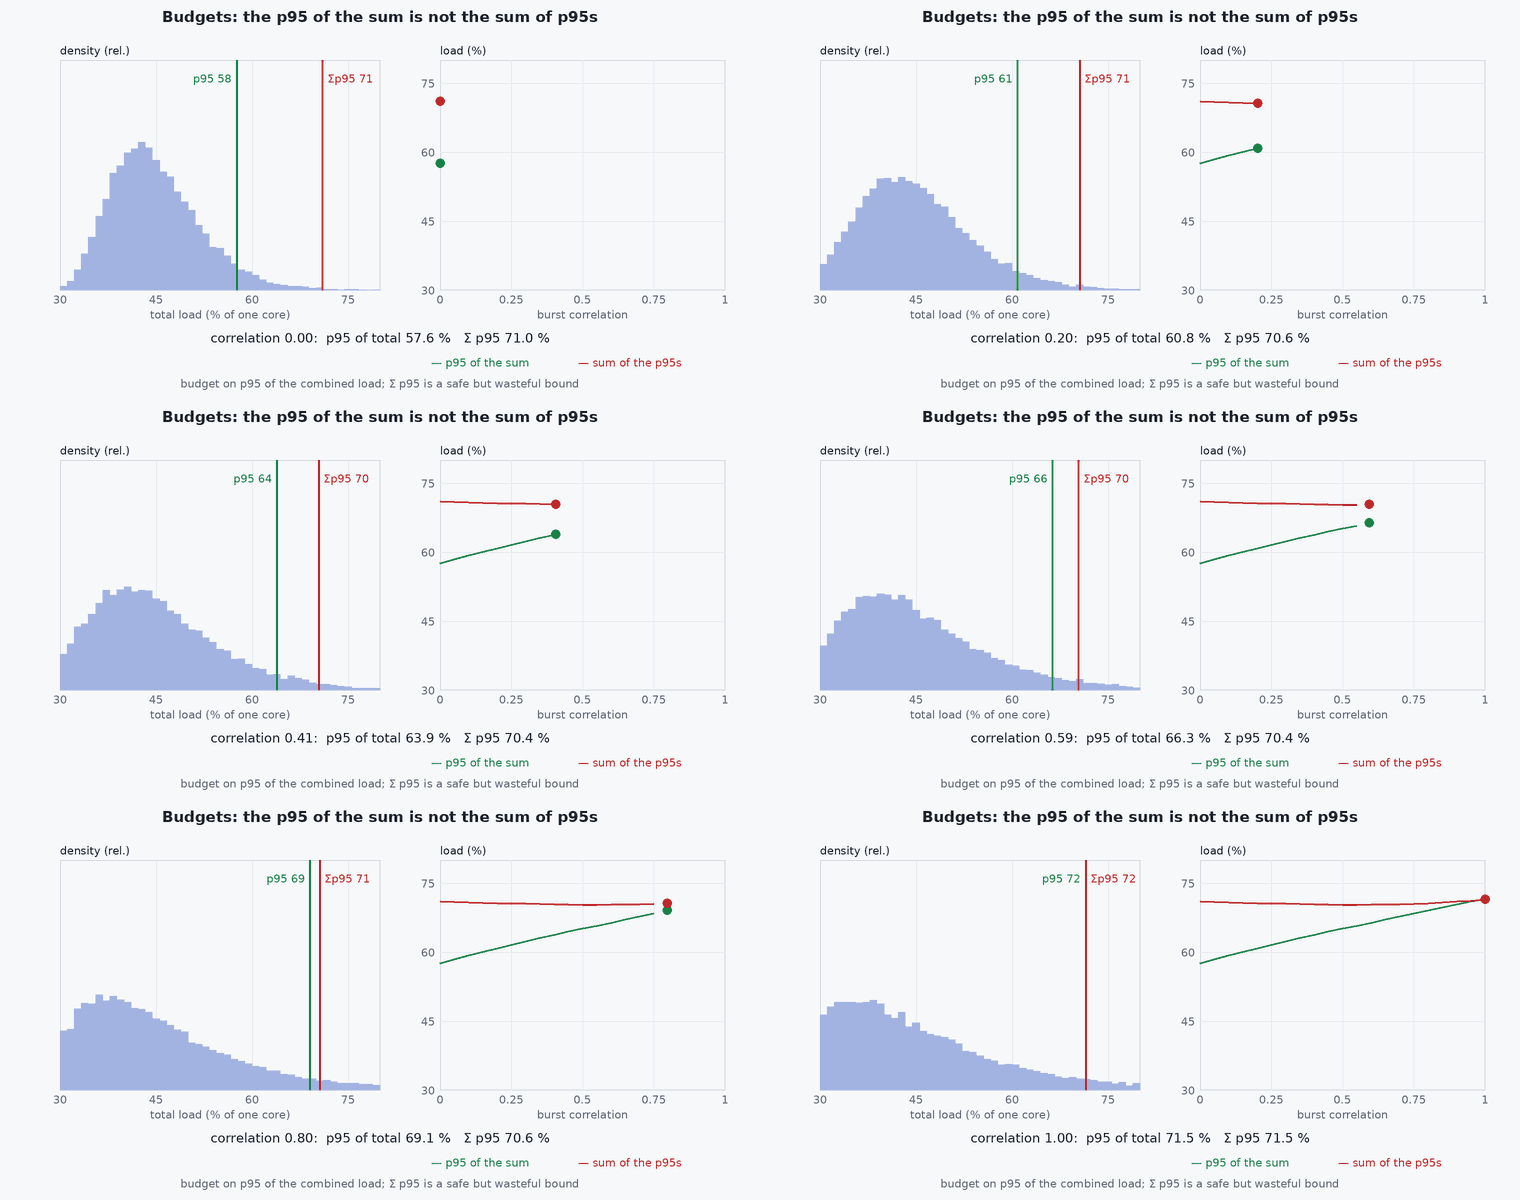
Adding up average CPU use is the classic budgeting error. Averages describe long-run capacity, but the system fails in bursts: when mapping, a detector and a replan all peak together. Peak loads of independent functions rarely coincide, so the sum of maxima is pessimistic and the sum of means optimistic; the truth is measured by running the functions together and taking the high percentile of the combined load.
Memory is the opposite: it is not a time-averaged resource. Resident set grows with map size and queue depths; the peak at the end of the longest mission is what matters, and a leak turns a passing budget into a failure after 40 minutes. Measure memory over a full-length mission, not a 2-minute test.
Mathematical formulation
For functions with utilisations (fraction of the resource) the combined load in a mode is the sum, but for percentile statements the sum of percentiles bounds the percentile of the sum from above. With independent functions of mean and standard deviation , a Gaussian approximation gives
which is less pessimistic than the sum of individual percentiles, and optimistic if loads are positively correlated (they often are: a busy scene raises detector, tracker and mapper load together). Use the measured combined distribution when possible. Headroom is − load/capacity, required ≥ . For memory, the budget is peak resident set plus allocator overhead plus the OS’s own use, against physical memory minus a safety reserve to avoid swapping.
- ,
- mean and standard deviation of function i’s load.
- standard normal quantile for the chosen percentile.
- minimum headroom required.
Architecture and data flow
Profilers and monitors on the target (top/htop, pidstat, tegrastats or nvidia-smi, ros2 topic bandwidth, perf) → recorded time series per process during mission-representative runs → budget script → table of means, percentiles, maxima, headroom per mode → review. The same script runs in continuous integration on recorded profiles so that a change in a function’s cost fails the build before it reaches the vehicle.
Real-world UAV applications
- Sizing a companion computer for a perception pipeline.
- Deciding which functions to disable in a degraded mode to keep the estimator on time.
- Reviewing a new feature’s cost against the remaining headroom.
- Providing evidence for the compute section of a design review.
Implementation example
This runs as shown. A budget calculator over per-mode measurements (synthetic here, labelled as placeholders): it computes mean, p95 and a Gaussian combined estimate, compares it with a Monte Carlo of correlated loads, and fails when headroom is below the margin.
import numpy as np
rng = np.random.default_rng(12)
# PLACEHOLDER measurements (fraction of a 6-core CPU): replace with measured time series per function on the target
functions = {'vio': (0.55, 0.06), 'detector (cpu part)': (0.30, 0.08), 'mapper': (0.45, 0.10), 'planner': (0.20, 0.12), 'comms+logging': (0.15, 0.03)}
modes = {'cruise-mapping': ['vio', 'detector (cpu part)', 'mapper', 'planner', 'comms+logging'], 'degraded-nav': ['vio', 'planner', 'comms+logging']}
capacity = 6.0; h_min = 0.25; rho = 0.5                                      # required headroom; assumed correlation between functions
def combined(mode, n=200000):
    names = modes[mode]; mu = np.array([functions[k][0] for k in names]); sd = np.array([functions[k][1] for k in names])
    C = rho * np.outer(sd, sd) + (1 - rho) * np.diag(sd ** 2)                 # correlated covariance
    x = rng.multivariate_normal(mu, C, n).clip(min=0).sum(axis=1)             # combined load samples
    gauss = mu.sum() + 1.645 * np.sqrt((sd ** 2).sum())
    return mu.sum(), np.percentile(x, 95), gauss
ok = True
for m in modes:
    mean, p95, gauss = combined(m); head = 1 - p95 / capacity
    print(f"{m:>15}: mean {mean:.2f} cores, p95 (correlated) {p95:.2f}, independent-Gaussian estimate {gauss:.2f}, headroom {head:.0%} -> {'PASS' if head >= h_min else 'FAIL'}")
    ok &= head >= h_min
m, p95, g = combined('cruise-mapping'); assert p95 > g          # correlation makes the independent estimate optimistic
assert okCommon engineering mistakes
Budget from averages
Failures come from combined peaks; use percentiles of the combined load.
Testing for two minutes
Memory growth and thermal throttling appear over a full mission.
Measuring on a dev machine
Budgets must come from the target in its enclosure.
One budget for all modes
Take the worst mode; check mode transitions too.
No owner or review date
Budgets rot; give each function a budget owner and re-measure on every release.
Failure modes
| Failure mode | How it shows up | Likely cause |
|---|---|---|
| Rare overload in flight | Frame drops or late estimator | Peaks of correlated loads exceed capacity |
| Out-of-memory after 40 minutes | Process killed | Leak or unbounded map or queue growth |
| Passing in lab, failing in flight | Lower throughput | Throttling or different load at altitude/lighting |
| New feature breaks the system | Latency regression | No budget check in continuous integration |
Debugging approach
- Plot combined load over time and look at the peaks and what runs at them.
- Track resident memory against time over a full mission.
- Compare budget predictions with the measured combined load.
- Re-measure after every software release.
Practical exercises
- Fill in a budget for CPU, GPU and memory for three modes of your own vehicle using measurements.
- Change the correlation to 0 and 0.9 and report the p95 and the headroom.
- Measure the resident memory of your map over a 30-minute mission.
- Write the CI check that fails when headroom falls below 25 %.
Interview questions
Write an answer in your own words, then reveal the model answer. Nothing is sent anywhere.
Question 1
Why not budget from average CPU use?
Model answer
Failures occur when loads peak together; averages hide bursts, and the combined peak depends on correlation, so the combined percentile must be measured.
Question 2
How do you set headroom margins?
Model answer
By the consequence of overrun and the uncertainty of the measurements: hard-real-time functions need larger margins than soft ones, and unmeasured or unrepresentative data needs more.
Question 3
Why measure memory over a full mission?
Model answer
Memory use grows with maps, queues and leaks; the peak at the end of the longest mission is what must fit, which short tests miss.
References and further reading
Primary papers, official documentation and standards. Each claim above that is specific to a tool or version points here.