UAV Systems Engineering · Module 7
M7-T3: CPU and GPU workload management
Workloads that are fine alone can fail together. Isolate the time-critical ones, bound the queues, and measure contention under the worst combined load.
An onboard pipeline is a set of processes competing for cores, memory bandwidth and the GPU. The average load tells you little: the estimator’s deadline is missed in the rare moments when everything peaks together. Managing the workload means isolating what must be predictable and bounding what can grow.
Learning objectives
After this lesson, you should be able to:
- Assign time-critical tasks to dedicated CPU cores with real-time priority.
- Bound queues between pipeline stages and choose a drop policy.
- Explain GPU and memory-bandwidth contention and how to measure it.
- Report latency with percentiles under combined load.
Conceptual explanation
Established Core affinity, scheduling priorities and queue management are standard Linux and systems practice. Whether isolation features (isolcpus, cgroups, real-time kernels) are available depends on the board support package.
Methods in order of effort:
- Core affinity: pin the estimator, drivers and sensor-capture threads to specific cores (
taskset,sched_setaffinity, or ROS 2 executor thread settings) and keep other work off them (kernel optionisolcpusor cgroup cpusets). - Priorities: real-time scheduling classes (
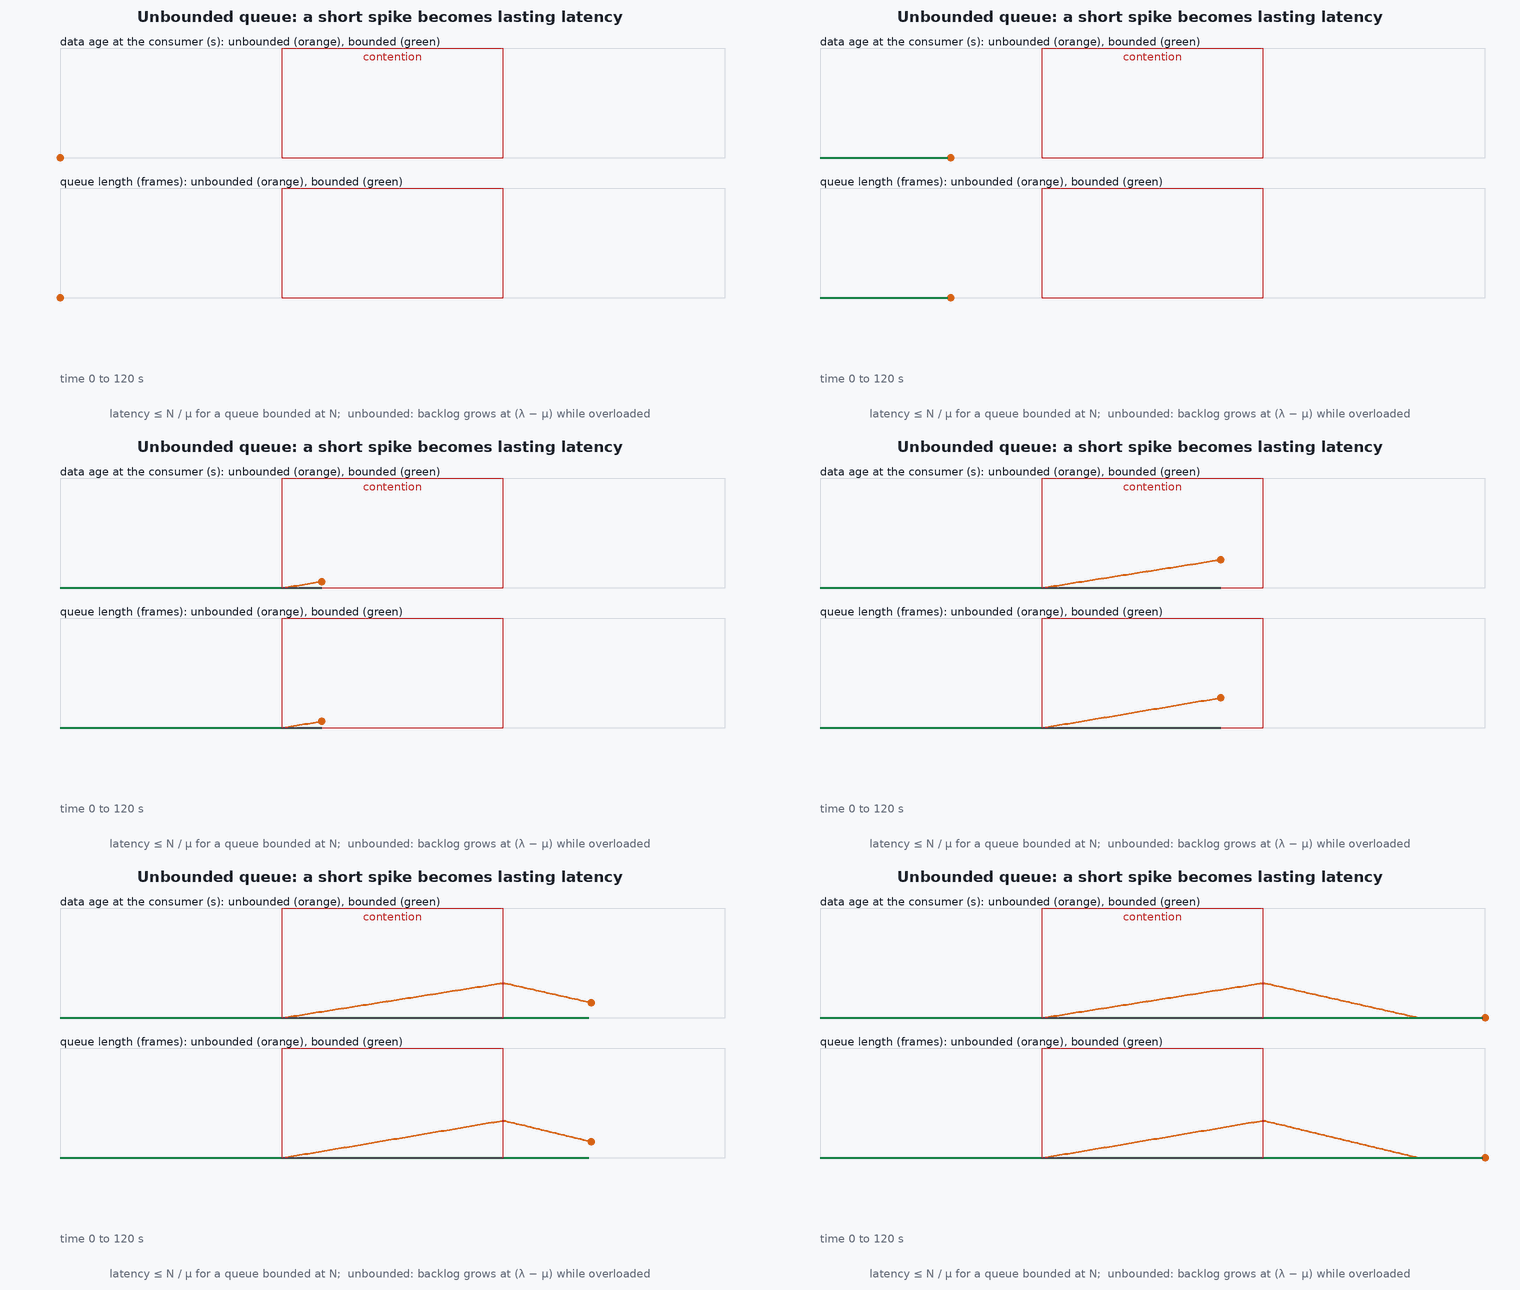
SCHED_FIFO,SCHED_RR) for time-critical threads, used carefully: a runaway real-time thread can starve the system. - Bounded queues: every stage-to-stage queue has a maximum length and a policy (drop oldest, drop newest, block). An unbounded queue turns a short overload into a permanently growing latency.
- GPU management: a single GPU executes kernels from several processes in time slices or concurrently; a long inference kernel delays another process’s kernels. Use streams and priorities where available, and keep batch sizes consistent.
- Memory bandwidth: CPU and GPU contend for the same DRAM on shared-memory modules; a bandwidth-heavy stage slows its neighbours even on different cores.
Engineering intuition
A queue is a promise of delay. If a camera produces 30 frames per second and the detector consumes 25, the queue grows by 5 frames every second; after a minute the detector is looking at images 12 seconds old. With a bound of two frames and a drop-oldest policy the detector sees frames at most about 80 ms old, at the cost of missing some. For state estimation and control that is almost always the right trade: fresh and incomplete beats complete and stale.
The second intuition is that interference is multiplicative at the tail. Two stages each with a p99 latency of 40 ms do not give a p99 of 40 ms together: their occasional peaks coincide more often than you think when they share a resource. So measure the combined pipeline, at the load of the worst mission phase.
Mathematical formulation
For a stage with service rate and arrival rate < μ, the M/M/1 queue has mean waiting time W = : it diverges as utilisation approaches 1, which is why a 95 % loaded stage is far worse than a 70 % loaded one. For deterministic arrivals and service the queue is empty when < μ and grows linearly when λ > :
Interference makes service times larger under contention: with a slowdown factor the effective service rate is , so a stage at alone is at 0.6 s when another process slows it by , i.e. 0.9, which is where latency starts to explode. Report p50, p95, p99 and maximum, never only the mean.
- ,
- arrival and service rates (1/s).
- utilisation .
- slowdown factor from contention.
- queue bound.
Architecture and data flow
Camera driver (pinned core, high priority) → bounded queue (drop oldest) → GPU inference (stream with priority) → bounded queue → tracker or mapper (shared cores) → planner → setpoints. In parallel: IMU driver → estimator (pinned core) → state. Telemetry and logging at low priority on other cores. A monitor records queue depths, drops, per-stage latency and core utilisation to the log.
Real-world UAV applications
- Keeping VIO real-time while a detector runs on the same module.
- Choosing core assignments and priorities for a multi-sensor pipeline.
- Setting queue sizes and drop policies for a camera pipeline.
- Explaining latency spikes seen in flight logs.
Implementation example
This runs as shown. A discrete-event simulation of a camera → inference pipeline with and without a bounded queue, with the inference stage slowed by contention in the middle of the run. It reports the age of the data reaching the consumer in percentiles.
import numpy as np
from collections import deque

def run(bound, T=120.0, fps=30.0, base_service=0.026, slow_window=(40.0, 80.0), slow=1.6):
    # a single server (inference) fed by a camera at fps; service time rises by 'slow' during the contention window
    t_arr = np.arange(0.0, T, 1 / fps); q = deque(); free_at = 0.0; ages = []; drops = 0; i = 0; now = 0.0
    events = list(t_arr)
    for ta in events:
        # start any services that finish before this arrival
        while q and free_at <= ta:
            tcap = q.popleft(); start = max(free_at, tcap)
            svc = base_service * (slow if slow_window[0] <= start < slow_window[1] else 1.0)
            free_at = start + svc; ages.append(free_at - tcap)           # age of the data when the result is produced
        if bound is not None and len(q) >= bound: q.popleft(); drops += 1   # drop the oldest frame
        q.append(ta)
    return np.array(ages), drops
for name, b in (('unbounded', None), ('bound = 2', 2)):
    ages, drops = run(b)
    print(f"{name:>10}: p50 {np.percentile(ages, 50) * 1e3:7.1f} ms  p99 {np.percentile(ages, 99) * 1e3:8.1f} ms  max {ages.max() * 1e3:8.1f} ms  dropped {drops}")
a_u, _ = run(None); a_b, d_b = run(2)
assert np.percentile(a_u, 99) > 5 * np.percentile(a_b, 99) and a_b.max() < 0.15 and d_b > 0Pinning a process and giving it real-time priority on Linux (needs privileges; test carefully):
taskset -c 2,3 chrt -f 50 ./estimator_node          # cores 2 and 3, SCHED_FIFO priority 50
cat /proc/cmdline                                       # check for isolcpus= and similar kernel options
ps -eLo pid,tid,class,rtprio,psr,comm | grep estimator # verify class, priority and the core each thread runs onCommon engineering mistakes
Unbounded queues
A short overload becomes permanent latency.
Real-time priority for everything
Priorities only work if few threads use them; otherwise nothing is protected.
Averaging latency
The tail decides deadline misses; use percentiles.
Measuring nodes in isolation
Contention appears only in the combined system at peak load.
Running logging and video on the estimator’s cores
Disk and encoder bursts cause jitter.
Failure modes
| Failure mode | How it shows up | Likely cause |
|---|---|---|
| Growing latency over time | Frame age keeps rising | Arrival rate above service rate with an unbounded queue |
| Estimator deadline misses at peak load | Jitter in state output | Shared cores or memory-bandwidth contention |
| System lockup | Frozen companion | A real-time thread spinning at high priority |
| GPU stalls | Long gaps between results | Competing long kernels from another process |
Debugging approach
- Plot queue depth, drops and data age against time.
- Check per-core utilisation and which threads run where.
- Run the pipeline with the worst-case combined load and record percentiles.
- Use tracing tools to see scheduling delays of the critical thread.
Practical exercises
- Change the bound to 1, 3 and 5 in the example and tabulate p99 age and drops.
- Add a second stage with its own bounded queue and measure the end-to-end age.
- Measure the slowdown factor of your estimator when the detector runs on neighbouring cores.
- Define the core assignment table for a four-core companion computer.
Interview questions
Write an answer in your own words, then reveal the model answer. Nothing is sent anywhere.
Question 1
Why bound queues between pipeline stages?
Model answer
An unbounded queue converts a transient overload into an ever-growing delay; a bound with a drop policy caps the age of the data at the cost of missing some, which is the right trade for estimation and control.
Question 2
Why does a stage at 95 % utilisation behave much worse than at 70 %?
Model answer
Queueing delay grows like , so it rises steeply as utilisation approaches 1, and any slowdown from contention pushes it past the limit.
Question 3
What should you report instead of mean latency?
Model answer
Percentiles (p50, p95, p99) and the maximum under the worst combined load, because deadline misses come from the tail.
References and further reading
Primary papers, official documentation and standards. Each claim above that is specific to a tool or version points here.