UAV Systems Engineering · Module 7
M7-T2: NVIDIA Jetson platforms
Jetson modules give a lot of embedded compute per watt. What you actually get depends on the power mode, the temperature and your own workload: measure it.
Jetson-class modules are a common choice for onboard perception. The marketing numbers are peaks under specific conditions. For a UAV what matters is sustained throughput at the power mode and temperature of the flight, with the CPU, GPU and memory shared among your processes.
Learning objectives
After this lesson, you should be able to:
- Describe Jetson power modes and clock management, and how to query and set them.
- Monitor utilisation, frequency, temperature and power with tegrastats and related tools.
- Explain thermal throttling and its effect on latency in flight.
- Convert vendor figures to measured budgets for your pipeline.
Conceptual explanation
Implementation-specific Jetson module families, JetPack releases, power-mode tables, tool options and supported frameworks change with each generation. This lesson names the mechanisms and tools but quotes no performance, power or price figures: read the module’s datasheet and developer guide for the exact model and JetPack version, and measure your workload.
A Jetson module is a system-on-module that combines ARM CPU cores, an NVIDIA GPU, (on some modules) dedicated deep-learning and vision accelerators, memory shared between CPU and GPU, and video and camera interfaces. The software stack (JetPack) provides Linux, CUDA, TensorRT, multimedia libraries and the tools below.
- Power modes (
nvpmodel): predefined configurations that set the number of active CPU cores, maximum clocks and a power budget. A lower mode saves power and reduces peak performance. - Clocks (
jetson_clocks): can pin clocks to their maximum for the selected mode, removing frequency-scaling variability (and increasing heat). - Monitoring:
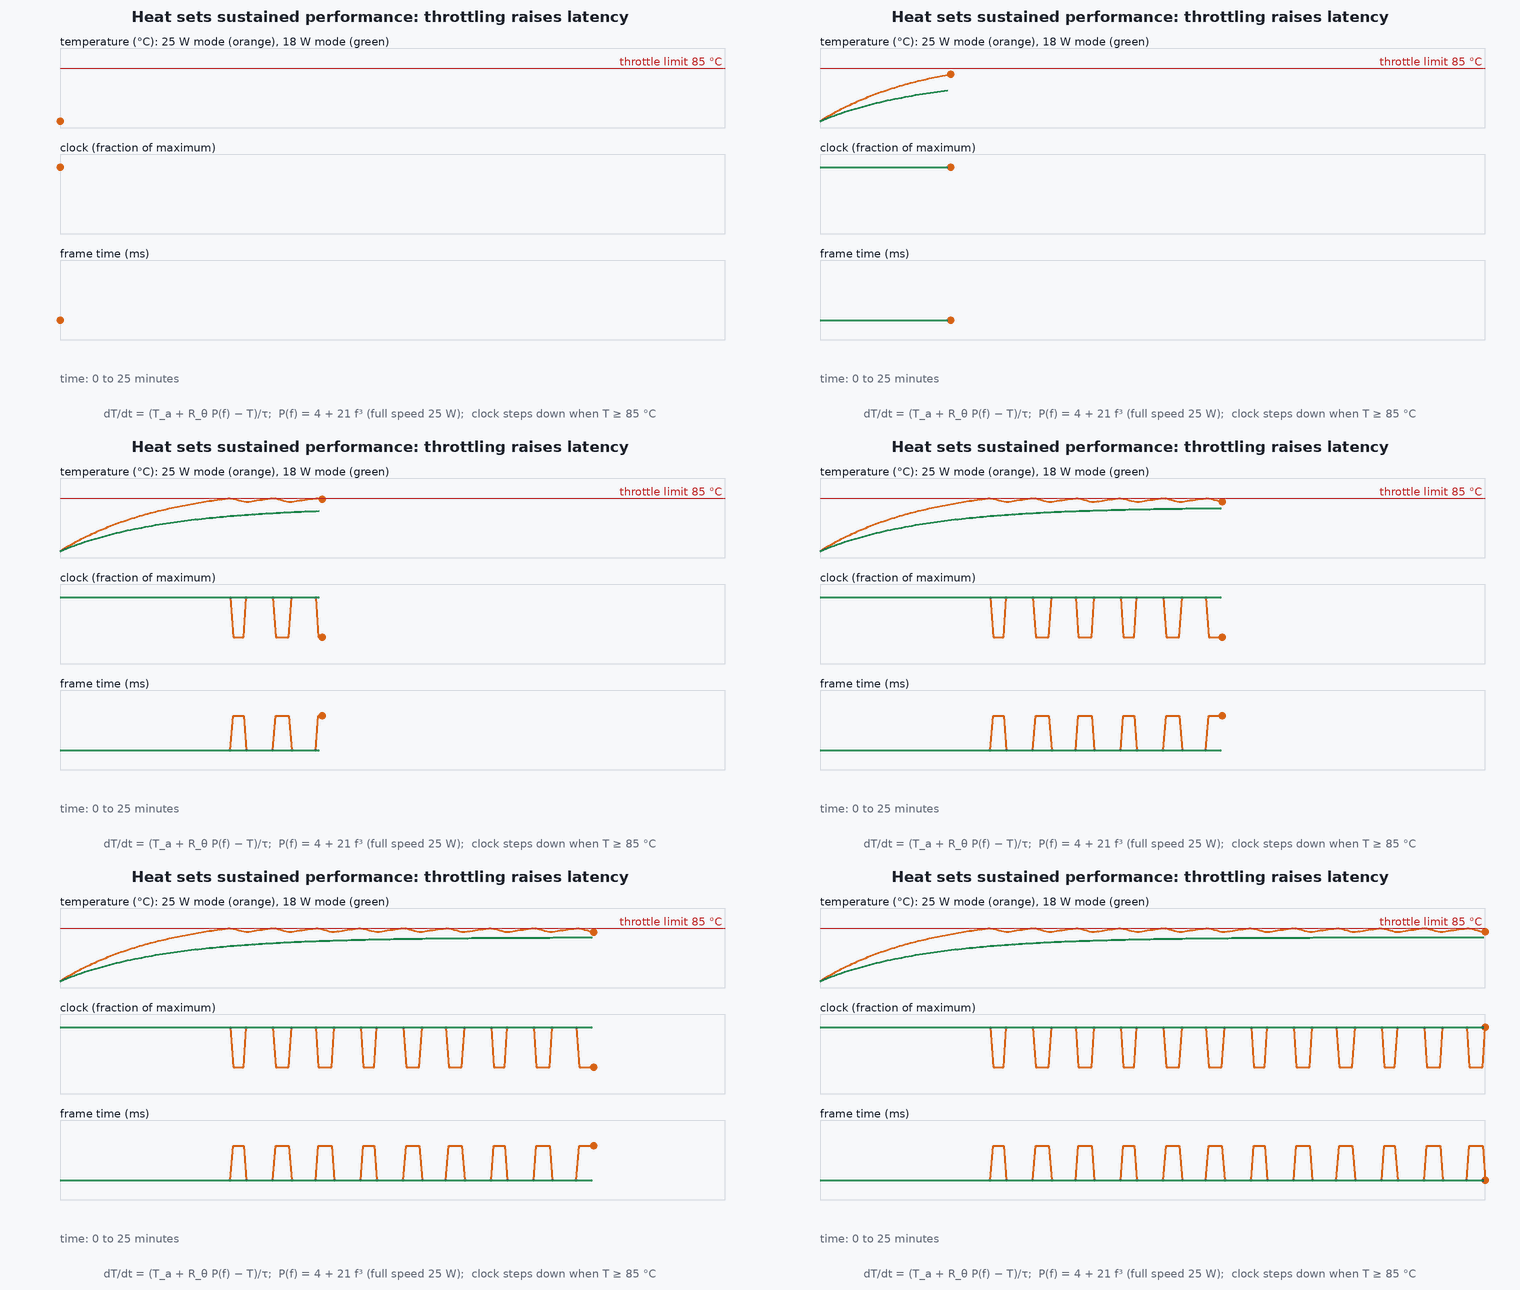
tegrastatsprints CPU load per core, GPU load, memory, temperatures and (on supported boards) power rails; the on-board sensors and power-monitor ICs differ between modules. - Throttling: when temperature or power limits are reached, the system lowers clocks to stay inside them. Throughput and latency then change over a flight.
Engineering intuition
A Jetson in a lab with a large heatsink and a fan is a different machine from the same module in a closed 3D-printed enclosure on a hot day at altitude with little airflow. Compute budgets quoted at room temperature on a dev kit overstate what you get at the end of a 25-minute flight. Treat thermal state as part of the performance specification.
Shared memory is both a strength and a trap: CPU and GPU use the same physical memory, so copies are cheap compared with a discrete GPU, but memory bandwidth is shared too. A perception node that saturates memory bandwidth slows the CPU-side estimator that is waiting for data. The cure is measurement of the whole pipeline together, not each node alone.
Mathematical formulation
Sustained performance follows a thermal balance. With power dissipation , ambient temperature , and a thermal resistance from junction to ambient (heatsink, airflow, enclosure), the steady-state junction temperature is
With a thermal capacitance the module heats exponentially with time constant , so a short burst can exceed until the temperature reaches the limit: . The time to throttle is . This is a first-order model with illustrative coefficients; measure the real and for your enclosure.
- thermal resistance junction-to-ambient (°C/W) of your installation.
- thermal time constant (s).
- throttle threshold of the module (from the datasheet).
Architecture and data flow
Camera (MIPI CSI or USB) → ISP and capture → memory (shared) → CUDA/TensorRT inference or VIO front end on the GPU → CPU back end and ROS 2 nodes → MAVLink/DDS to the flight controller. Monitoring: tegrastats and power rail sensors → logger on the companion → flight log alongside timestamps, so that throttling events can be correlated with latency spikes.
Real-world UAV applications
- Running TensorRT detection or segmentation onboard.
- VIO and lidar odometry on the companion.
- Choosing a power mode for flight versus ground testing.
- Thermal qualification of the enclosure in a heat chamber or a hot-day test.
Implementation example
This runs as shown. A first-order thermal model of a Jetson-class module (illustrative coefficients, not vendor figures) to compute sustained power and time-to-throttle for a mission, plus a parser for tegrastats-style lines so you can analyse your own recordings (the format below is a simplified, made-up example; check the real output of your JetPack version and adapt the regular expressions).
import numpy as np, re

R_th, C_th = 2.5, 40.0                    # ILLUSTRATIVE: degC/W and J/degC for an enclosed module; measure your own
T_limit, T_a, T0 = 85.0, 35.0, 45.0
tau = R_th * C_th
def time_to_throttle(P):
    if R_th * P + T_a <= T_limit: return None                     # sustained: never reaches the limit
    return tau * np.log((R_th * P - (T0 - T_a)) / (R_th * P - (T_limit - T_a)))
P_sus = (T_limit - T_a) / R_th
print(f"sustained power limit {P_sus:.1f} W; time to throttle at 25 W: {time_to_throttle(25.0):.0f} s, at 15 W: {time_to_throttle(15.0)}")
assert abs(P_sus - 20.0) < 1e-9 and time_to_throttle(15.0) is None and 100 < time_to_throttle(25.0) < 400

# parsing a tegrastats-like log (SIMPLIFIED EXAMPLE FORMAT; adapt to your JetPack version)
log = ["RAM 3100/7800MB CPU [45%@1500,52%@1500,40%@1500,38%@1500] GPU 62%@900 temp_gpu@58C temp_cpu@55C",
       "RAM 3120/7800MB CPU [60%@1500,58%@1500,55%@1500,49%@1500] GPU 91%@900 temp_gpu@64C temp_cpu@61C",
       "RAM 3130/7800MB CPU [61%@1100,59%@1100,53%@1100,50%@1100] GPU 93%@620 temp_gpu@83C temp_cpu@70C"]
def parse(line):
    gpu = re.search(r'GPU (\d+)%@(\d+)', line); t = re.search(r'temp_gpu@(\d+)C', line)
    return int(gpu.group(1)), int(gpu.group(2)), int(t.group(1))
rows = [parse(l) for l in log]; f0 = rows[0][1]
print([f"util {u}% freq {f} MHz temp {t} C" for u, f, t in rows])
assert rows[-1][1] < f0 and rows[-1][2] > rows[0][2] # frequency fell while temperature rose: a throttling signatureThe real commands to start from (check them against the documentation for your JetPack version):
sudo nvpmodel -q                  # query the current power mode
sudo nvpmodel -m <mode-id>        # set a power mode (ids are listed in the module's documentation)
sudo jetson_clocks --show         # show clock settings
sudo tegrastats --interval 1000 # CPU, GPU, memory, temperature (and power on supported boards) each secondCommon engineering mistakes
Using datasheet peak performance as a requirement
Measure sustained performance for your workload and temperature.
Testing only at room temperature
Throttling appears at the end of a long, hot flight.
Pinning clocks to the maximum without a thermal check
Higher heat; throttling hits later and harder.
Measuring each node alone
Contention for memory bandwidth and the GPU only shows in the whole pipeline.
Unrecorded power mode
Results are not reproducible; log the mode, JetPack version and clocks with each test.
Failure modes
| Failure mode | How it shows up | Likely cause |
|---|---|---|
| Latency rises during a flight | Frame rate falls over time | Thermal throttling: clocks drop as temperature climbs |
| Brown-out or reset on load | Companion reboots | Supply sag or inrush at high-power mode |
| Perception slower than in the lab | Lower throughput | Different power mode, memory contention or thermal limit |
| Inconsistent timing | Jitter in node rates | Dynamic frequency scaling or other processes |
Debugging approach
- Log tegrastats continuously and plot frequency, temperature and utilisation against the pipeline’s latency.
- Repeat the test with fixed clocks to remove frequency scaling.
- Run the pipeline in the enclosure, not on the bench.
- Record the JetPack version, power mode and module for every test.
Practical exercises
- Run your perception pipeline for 30 minutes in the enclosure and plot temperature, frequency and frame time.
- Measure by running a constant load until the temperature settles and dividing by the power.
- Compare latency percentiles (p50, p99) in two power modes.
- Write the thermal requirement for your enclosure with a margin and a test to verify it.
Interview questions
Write an answer in your own words, then reveal the model answer. Nothing is sent anywhere.
Question 1
Why can a Jetson run slower at the end of a flight than at the start?
Model answer
Thermal throttling: as the temperature approaches the limit the system lowers clocks to stay within it, which increases processing time and latency.
Question 2
How do you turn a vendor performance figure into a design number?
Model answer
Treat it as an upper bound; measure your own pipeline in the chosen power mode at flight temperature, take a high percentile and add margin.
Question 3
What does nvpmodel do?
Model answer
It selects a predefined power mode: the number of active cores and the maximum clocks within a power budget, trading performance for power and heat.
References and further reading
Primary papers, official documentation and standards. Each claim above that is specific to a tool or version points here.