UAV Systems Engineering · Module 7
M7-T6: End-to-end latency
Latency is a budget, jitter is a risk, and both are measured from the moment the world was sensed, not from the moment the message arrived.
Every stage of the pipeline from camera to motors adds delay. A 100 ms delay at 8 m/s is 0.8 m of position error before any algorithm makes a mistake, and a controller that ignores it can oscillate. This lesson makes latency a quantity you budget, measure and test.
Learning objectives
After this lesson, you should be able to:
- Decompose end-to-end latency into stages and write a latency budget.
- Convert delay into position error and into a control-stability concern.
- Measure latency and jitter from timestamps and report percentiles.
- Explain queueing, executors and buffering as sources of tail latency in ROS 2.
Conceptual explanation
Implementation-specific Typical stage values depend on the sensor, drivers, middleware settings and hardware. Measure your own system: the numbers in the example are illustrative.
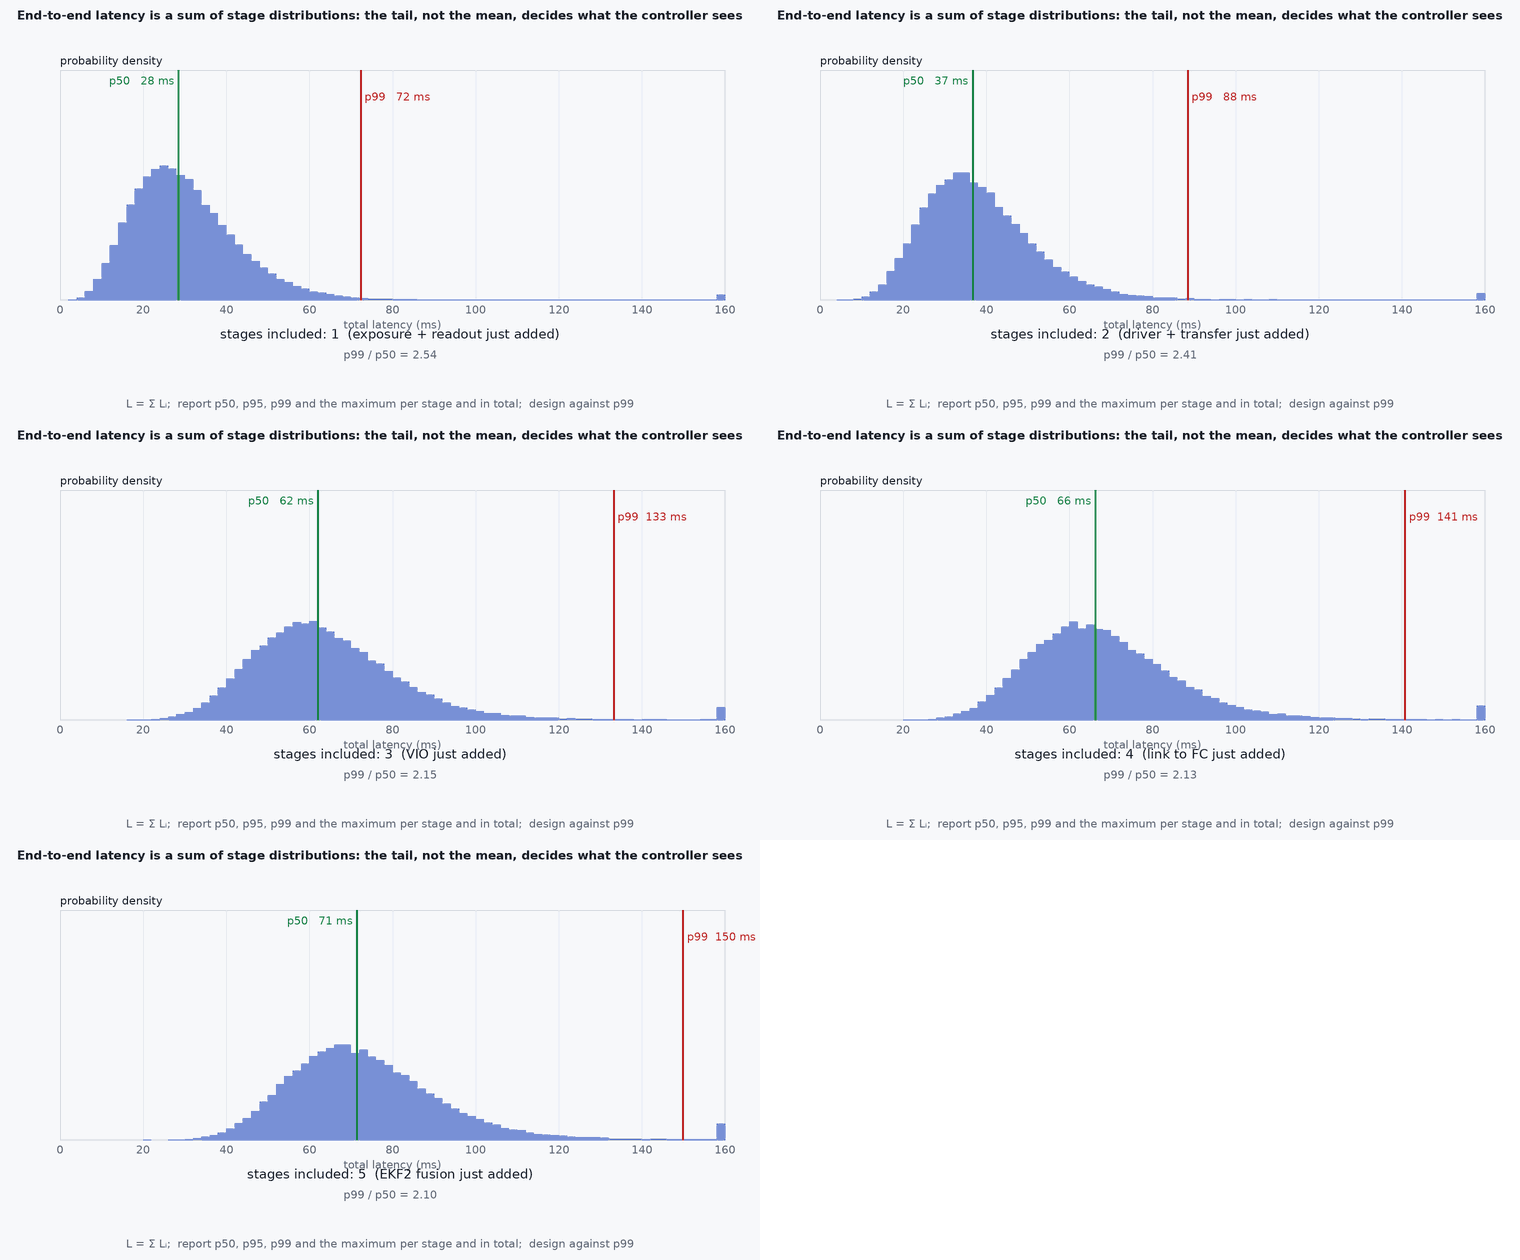
Latency is the time from a physical event to the system’s response to it. Define it from the measurement’s timestamp (when the sensor sampled the world), through every stage, to the actuation or the published command. Jitter is the variation of latency from one sample to the next. A fixed delay can be modelled and compensated; variable delay cannot be, which is why jitter is more dangerous than a constant delay of the same mean.
Engineering intuition
Two consequences matter. First, delay becomes position error: the vehicle has moved · by the time you act on what you saw. Second, delay costs stability margin: a pure delay adds phase lag that grows with frequency, so a controller tuned for no delay can ring or oscillate when a 100 ms vision loop sits inside it. The cure is a mix of reducing delay (faster stages, less queueing), compensating a known delay (predict the state forward with the IMU), and keeping control loops that must be fast off the slow path: the attitude loop runs on the flight controller and never waits for vision.
Mathematical formulation
Position error from an uncompensated delay at speed :
A pure delay contributes phase lag − (radians) at frequency . A loop with crossover frequency loses a phase margin of about : a 1 Hz crossover with 100 ms of delay loses , a large fraction of a typical margin.
Percentiles, not means
Report the median, the 95th, 99th and maximum latency. A pipeline with a mean of 40 ms and a 99th percentile of 180 ms behaves like a 180 ms system when the worst case happens during a fast manoeuvre. Deadline-miss rate (fraction of samples over a threshold) is the number that connects to safety.
Queueing
If a stage takes longer on average than the interval between inputs (utilisation ≥ 1), its queue grows without bound and latency grows with it. Even below 1, bursts make latency variable. Use bounded queues of depth 1 for sensor streams so that stale data are dropped instead of processed late.
Architecture and data flow
Timestamps flow with the data: each message carries the sensor’s acquisition time, and every stage forwards it (it does not re-stamp with the processing time). A monitor at the end computes now − stamp per output. Stage latencies come from spans logged between stages or from the ROS 2 tracing tools (for example ros2_tracing); the sum of the stage medians should match the end-to-end median, and a gap means you are missing a stage (often a queue or a driver buffer).
Real-world UAV applications
- Choosing between a 30 Hz and a 60 Hz camera: higher rate lowers latency as well as raising update rate.
- Setting EKF2’s external-vision delay or sample timestamps (lesson M6-T10).
- Deciding whether an MPC with a 15 ms worst-case solve fits in a 50 Hz loop.
- Deciding what must stay on the flight controller and what can run on the companion.
Implementation example
This runs as shown: it analyses a synthetic log of stage timestamps. It reports percentiles, the deadline-miss rate, the position error implied by the 99th percentile, and finds the stage that contributes the tail.
import numpy as np
rng = np.random.default_rng(8)
n = 5000
# Synthetic per-frame stage latencies in milliseconds (illustrative distributions, not measurements of any device)
stages = {
    "exposure+readout": 12 + 2 * rng.random(n),
    "driver/transport": 6 + 3 * rng.random(n),
    "perception (VIO)": 18 + rng.gamma(2.0, 2.0, n),
    "estimator":        4 + rng.gamma(2.0, 0.5, n),
    "planner (MPC)":    5 + rng.gamma(1.5, 1.0, n) + (rng.random(n) < 0.01) * 40,      # 1% of solves overrun
    "flight ctrl + motors": 20 + 2 * rng.random(n),
}
total = sum(stages.values())
p50, p95, p99, pmax = np.percentile(total, [50, 95, 99, 100])
print(f"end-to-end: p50 {p50:.0f} ms, p95 {p95:.0f} ms, p99 {p99:.0f} ms, max {pmax:.0f} ms")
deadline = 100.0                                                    # requirement: 100 ms
miss = np.mean(total > deadline)
print(f"deadline misses (> {deadline:.0f} ms): {100 * miss:.2f}%   position error at 8 m/s, p99: {8 * p99 / 1000:.2f} m")
# which stage contributes the tail? compare each stage's contribution on the worst 1% of frames with its overall mean
worst = total >= p99
for name, v in stages.items():
    print(f"  {name:22s} mean {v.mean():5.1f} ms | in worst 1%: {v[worst].mean():5.1f} ms")
tail_stage = max(stages, key=lambda k: stages[k][worst].mean() - stages[k].mean())
print("largest tail contributor:", tail_stage)
assert tail_stage.startswith("planner") and p99 > p50 + 10 and abs(sum(v.mean() for v in stages.values()) - total.mean()) < 1e-9Common engineering mistakes
Reporting average latency only
Safety depends on the tail. Always report p95, p99 and maximum, and the deadline-miss rate.
Measuring from message arrival
Latency starts at sensor exposure. Arrival time hides driver and transport delay.
Unbounded queues on sensor streams
Overload turns into growing latency instead of dropped frames. Use depth-1 queues.
Re-stamping messages with processing time
It destroys the information needed for delay compensation and fusion.
Assuming the network and middleware add nothing
Serialisation, copies, DDS discovery and QoS settings all contribute: measure with the real QoS.
Failure modes
| Failure mode | How it shows up | Likely cause |
|---|---|---|
| Position lag in motion | Map and pose trail the vehicle at speed | Large constant latency not compensated |
| Intermittent glitches | Occasional jumps while average latency looks fine | Tail latency from a GC pause, an overrunning solver or a bursty driver |
| Growing latency | Delay rises over minutes | Stage slower than its input rate and an unbounded queue |
| Control oscillation | Slow oscillation when vision is in the loop | Phase lag from delay inside a feedback path |
Debugging approach
- Add acquisition timestamps at the source and log
now − stampat each stage and at the output. - Run with tracing enabled (ros2_tracing, perf) and attribute the tail to a stage.
- Test under realistic load (all sensors, logging on, thermal throttling) because latency depends on load.
- Set CPU governor and power mode explicitly: frequency scaling changes timing.
Practical exercises
- Compute the phase lag in degrees of 80 ms delay at 2 Hz.
- Modify the code so the planner’s overrun rate is 5% and find the p99 position error at 10 m/s.
- Design a budget for a 100 ms end-to-end requirement and assign each stage a limit.
- Explain why a depth-1 queue plus “drop oldest” is the right default for a camera stream.
Interview questions
Write an answer in your own words, then reveal the model answer. Nothing is sent anywhere.
Question 1
Why report latency percentiles?
Model answer
Means hide the tail, and failures happen in the tail: a rare 200 ms delay during a manoeuvre matters more than a 40 ms average.
Question 2
How does delay affect a control loop?
Model answer
A delay adds phase lag at frequency , reducing phase margin; vision-in-the-loop controllers can oscillate unless the delay is small, compensated, or kept out of the fast loop.
Question 3
Where should latency be measured from?
Model answer
From the sensor exposure timestamp, through every stage, to the output; arrival time omits driver and transport delay.
References and further reading
Primary papers, official documentation and standards. Each claim above that is specific to a tool or version points here.
- ROS 2: Quality of Service settings
- ros2_tracing: tracing and latency analysis for ROS 2
- . . Åström, . . Murray, Feedback Systems, Princeton University Press, 2008 (time delay and stability margins).