UAV Systems Engineering · Module 7
M7-T7: Jitter and deadline monitoring
You cannot manage timing you do not measure. Monitor every critical loop and set thresholds from what the controller can tolerate.
Jitter is the difference between when a periodic task should run and when it does. Control and estimation algorithms assume a sample time; jitter makes that assumption false. A timing monitor turns invisible degradation into a log entry, a warning or a safe-state transition.
Learning objectives
After this lesson, you should be able to:
- Measure period, jitter and deadline misses from timestamps using a monotonic clock.
- Derive a jitter and miss threshold from the control loop’s tolerance.
- Design watchdog thresholds and actions with hysteresis.
- Report timing statistics in percentiles and as exceedance counts.
Conceptual explanation
Established The statistics and monitor design are standard practice. The tolerance of a particular controller to jitter must come from analysis or test of that controller; the example numbers below are illustrative.
For a periodic task with nominal period and release times , define:
- Period error , from the actual start (or output) timestamps.
- Jitter: the spread of , reported as standard deviation and as the peak-to-peak or high percentiles; sometimes defined as the deviation of from the ideal grid , which separates drift from jitter.
- Deadline miss: completion later than the deadline (often ); count misses and consecutive misses.
- Execution time: measured separately, to tell overload (long execution) from scheduling delay (late start).
Engineering intuition
Control laws assume a constant . Jitter turns that into a random , which adds noise to derivatives (velocity = ) and to integration. A controller that tolerates 1 ms of jitter on a 4 ms cycle may be fine; a Kalman filter assuming 10 ms with real intervals of 6 or 14 ms integrates the IMU incorrectly unless it uses the true timestamps. So there are two responses: use true timestamps in the algorithms, and monitor the jitter to detect when the system has left its validated envelope.
Monitor the right place: at the task’s start, its end and its output publication. Timestamping inside the task shows the scheduling delay only after it has already happened.
Mathematical formulation
If the controller’s discretisation assumes but the true sample time is + , a derivative computed as with the nominal has relative error e/( + ). A velocity estimate from position differences has error
Hence use measured , or limit the tolerated jitter: for an error budget at speed the jitter limit is . Watchdog detection time with a timeout of periods is plus the monitor’s own period. For miss statistics, with independent miss probability per cycle, the probability of consecutive misses is ; real overruns are correlated (bursty), so measure the run length of consecutive misses directly instead of inferring it from .
- period (or timing) error of one cycle.
- _max,
- velocity error budget and the maximum speed.
- number of missed periods before the watchdog fires.
Architecture and data flow
Each critical task records a monotonic timestamp at start and end of every cycle into a lock-free ring buffer. A low-priority monitor task reads it, computes the statistics over a sliding window and publishes a health topic (period, jitter percentiles, miss count, consecutive-miss maximum). A supervisor consumes the health topic and the heartbeat and decides on warnings, degraded modes or a controlled stop. Statistics are also logged with the flight log for post-flight analysis.
Real-world UAV applications
- Validating that a custom control module meets its timing before flight.
- Detecting thermal throttling or overload in flight.
- Setting watchdog thresholds for a companion-computer link.
- Comparing timing before and after a software change.
Implementation example
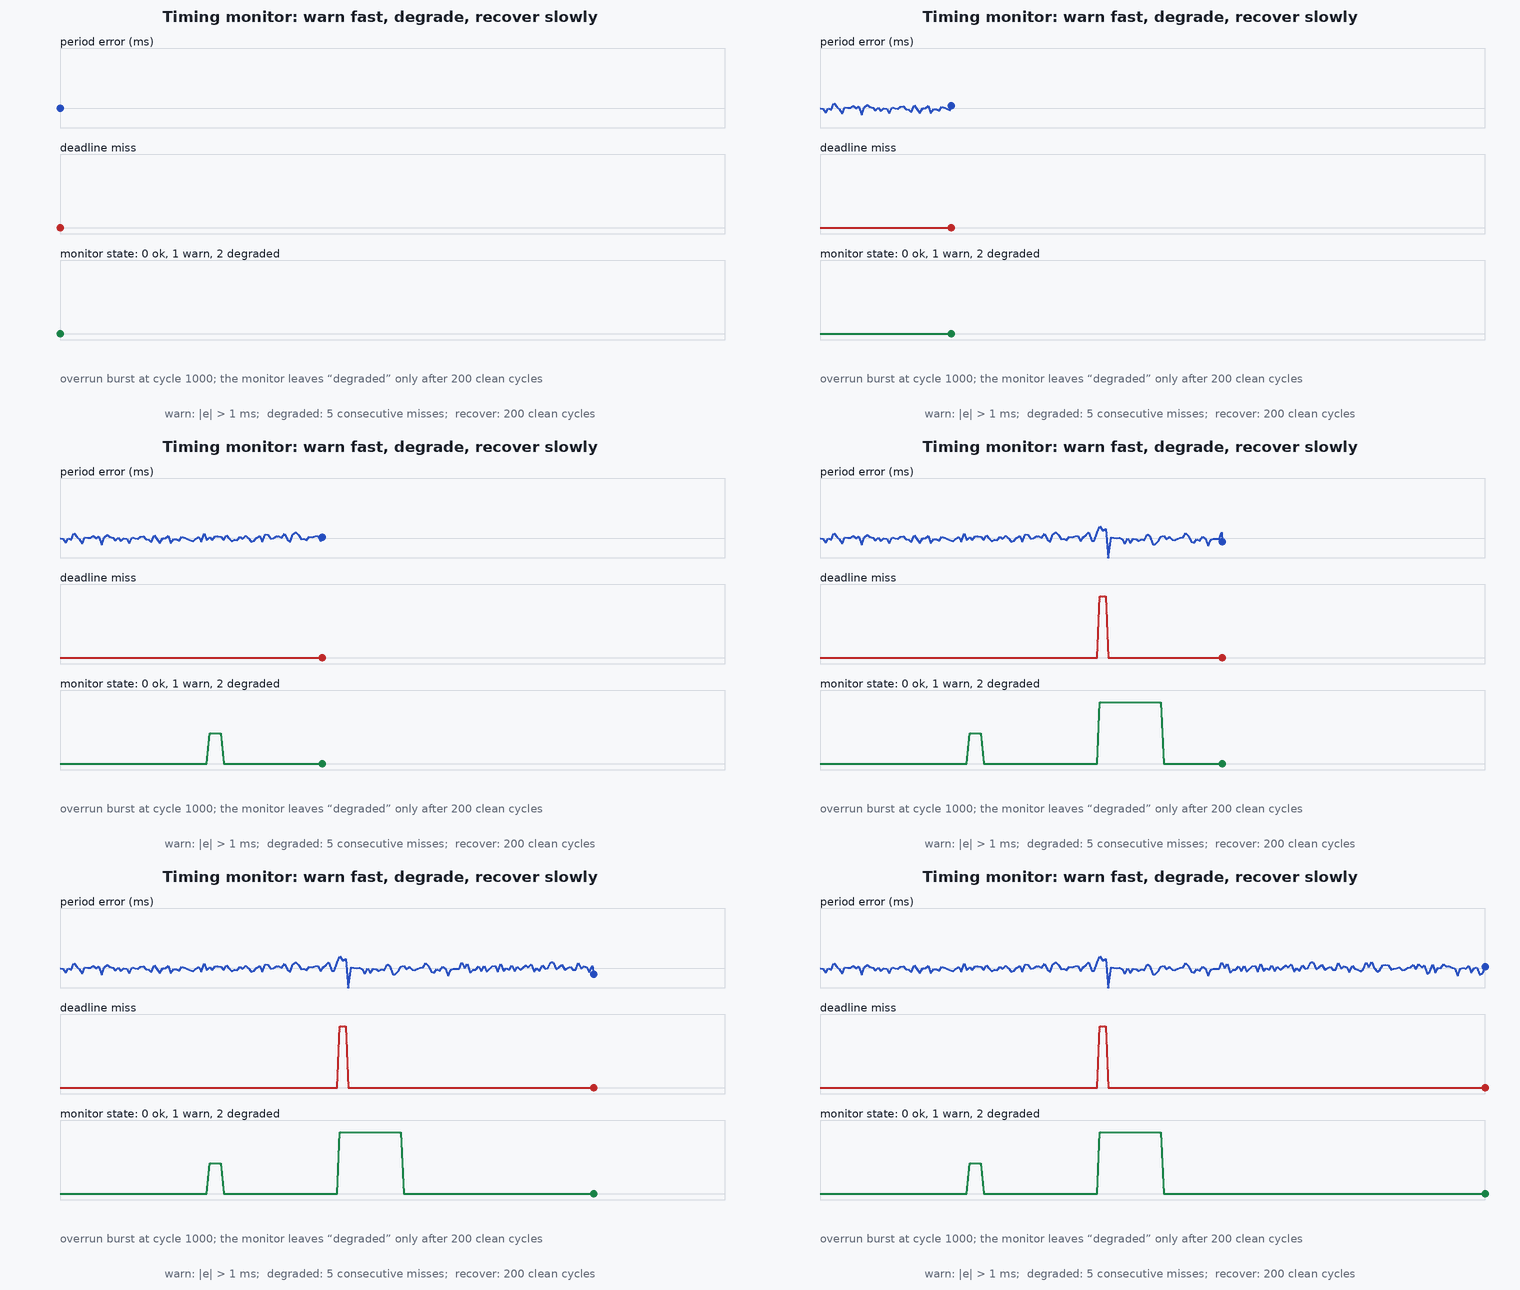
This runs as shown. A timing analyser on a synthetic cycle log (a 4 ms task with Gaussian jitter and a burst of overruns): period error statistics, percentiles, consecutive deadline misses and a three-level monitor with hysteresis.
import numpy as np
rng = np.random.default_rng(6)
T = 0.004; n = 20000
start = np.arange(n) * T + 0.0002 * rng.standard_normal(n)                       # start times with 0.2 ms jitter
burst = slice(12000, 12040); start[burst] += np.cumsum(np.full(40, 0.0008))      # overrun burst: the task falls behind by up to 32 ms
exec_t = 0.0006 + 0.0001 * rng.random(n); end = start + exec_t
deadline = np.arange(n) * T + T                                                  # D = T relative to the ideal release
miss = end > deadline                                                            # a miss: completion after the next ideal release
period_err = np.diff(start) - T
def max_run(b):
    best = cur = 0
    for v in b: cur = cur + 1 if v else 0; best = max(best, cur)
    return best
print(f"period error: std {period_err.std() * 1e3:.3f} ms, p99.9 {np.percentile(np.abs(period_err), 99.9) * 1e3:.3f} ms; misses {miss.sum()}, longest run {max_run(miss)}")
# three-level monitor with hysteresis: warn if |period error| > 1 ms, degrade after 5 consecutive misses, recover after 200 clean cycles
state = 'ok'; clean = 0; consec = 0; transitions = []
for k, (e, m) in enumerate(zip(np.r_[0, period_err], miss)):
    consec = consec + 1 if m else 0; clean = clean + 1 if (not m and abs(e) < 0.001) else 0
    new = state
    if consec >= 5: new = 'degraded'
    elif state == 'degraded' and clean >= 200: new = 'ok'
    elif state == 'ok' and abs(e) > 0.001: new = 'warn'
    elif state == 'warn' and clean >= 50: new = 'ok'
    if new != state: transitions.append((k, new)); state = new
print("transitions:", transitions[:6])
assert max_run(miss) >= 5 and any(s == 'degraded' for _, s in transitions)
assert abs(5.0 * 0.002 / 0.010 - 1.0) < 1e-12 # the velocity-error example of the maths section: v e / T = 1 m/sCommon engineering mistakes
Using the wall clock for timing
It can jump with synchronisation; use a monotonic clock.
Timestamping the output only
You cannot tell scheduling delay from execution time.
Thresholds copied from another project
Derive them from your controller’s tolerance.
Reporting mean and standard deviation only
Jitter distributions are heavy-tailed; report percentiles and maxima.
No hysteresis
The system flaps between states and floods the log.
Failure modes
| Failure mode | How it shows up | Likely cause |
|---|---|---|
| Control quality degrades with load | More oscillation at busy times | Jitter increases with CPU load |
| Watchdog resets in flight | Unexpected reboot | Threshold too tight or a long, rare stall |
| Hidden overruns | No indication in the logs | Monitor only on the mean |
| Clock jump confusion | Negative | Wall clock used instead of monotonic |
Debugging approach
- Log the start, end and execution time per cycle for the critical tasks.
- Plot period error histograms with a log axis to show the tail.
- Correlate overruns with other activity (logging, GC, thermal throttling).
- Run the monitor offline on recorded logs to tune thresholds.
Practical exercises
- Compute the jitter limit for a 0.2 m/s velocity error budget at 8 m/s with a 5 ms cycle.
- Measure the period error histogram of a node of yours and report p50, p99, p99.9 and the maximum.
- Add a hold-off so a single miss does not trigger the warning, and justify its length.
- Write the watchdog policy (thresholds, actions, recovery) for the estimator.
Interview questions
Write an answer in your own words, then reveal the model answer. Nothing is sent anywhere.
Question 1
How do you measure jitter?
Model answer
Record monotonic timestamps at the start (and end) of each cycle, compute the period error against the nominal period or the ideal grid, and report percentiles and the maximum alongside deadline misses and the longest run of consecutive misses.
Question 2
How do you choose a jitter threshold?
Model answer
From the control requirement: the tolerated error in derived quantities (for example velocity error = / ) fixes the allowed timing error, with margin.
Question 3
Why hysteresis in a timing monitor?
Model answer
Without it a borderline condition toggles states repeatedly, flooding logs and causing mode flapping; thresholds for entering and leaving a state should differ.
References and further reading
Primary papers, official documentation and standards. Each claim above that is specific to a tool or version points here.