UAV Systems Engineering · Module 1
M1-T10: NVIDIA Jetson platforms for autonomous UAVs
Pick the module from your measured workload and your power budget, not from a headline TOPS number.
Jetson-class modules put a GPU on a drone, and they are the usual companion computer for onboard perception. This lesson gives a selection method that works whatever the current product line is, and the tools to measure what your pipeline really costs.
Learning objectives
After this lesson, you should be able to:
- State the selection criteria for an onboard computer: compute, memory, power, mass, I/O and software support.
- Use vendor documentation for specifications without relying on remembered numbers.
- Use power modes and monitoring tools to measure utilisation.
- Build a mass, power and thermal budget for the module including carrier board and cooling.
Conceptual explanation
NVIDIA’s Jetson family consists of system-on-modules combining ARM CPU cores, a GPU, memory and hardware encoders and accelerators, with a carrier board providing connectors (camera, Ethernet, USB, UART, CAN). Product generations and their specifications change; the vendor’s module datasheets and the JetPack release notes are the authority for the numbers, and this track deliberately does not quote them.
Engineering intuition
Compute is not one number. A perception pipeline mixes CPU-bound steps (feature tracking, estimation), GPU-bound steps (neural networks, dense stereo) and memory-bound steps (point-cloud processing), and its real cost is set by whichever resource saturates first, often memory bandwidth or CPU cores feeding the GPU. A module with more peak operations may be no faster for your pipeline. Measure, in the power mode you will fly in, with the full pipeline running and the cameras attached, and add margin: thermal throttling under a closed airframe at a hot ambient is the usual surprise.
Mathematical formulation
Power-limited operation: the thermal budget is the dissipated power times the thermal resistance from die to air, and the module throttles when the die temperature reaches its limit:
Flight-time cost of the payload: every watt consumed reduces endurance, and every gram of module, carrier, heatsink and extra battery reduces it again through hover power (lesson M1-T2). The marginal cost can be estimated from the hover power per kilogram: ≈ (dP/dm) with , so dP/dm = 1.5 P/m.
- ,
- thermal resistances (°C/W): from the vendor’s thermal design guide and your cooling arrangement.
- the throttle threshold from the vendor documentation.
Architecture and data flow
Tools on JetPack that matter: nvpmodel selects the power mode (cores and clocks), jetson_clocks pins clocks high for benchmarking, and tegrastats prints CPU, GPU, memory, temperature and power per interval. Their exact output format varies between releases: parse defensively and check the format on your version. Camera inputs reach the module via CSI, USB or Ethernet depending on the carrier; synchronisation hardware (trigger, PPS or PTP) is a carrier-board feature to check at selection time.
Real-world UAV applications
- Running stereo VIO or LIO and a detector on a 1–2 kg vehicle.
- Comparing modules for a fixed pipeline by measured frame rate and power.
- Deriving the power mode to fly in from the measured mission load.
- Budgeting airflow in an enclosed airframe.
Implementation example
This runs as shown: a defensive parser for tegrastats-style lines (the sample line is synthetic and for illustration; check the output format of your JetPack version) and a per-run summary that reports peak and mean utilisation, the numbers a compute budget needs.
import re, statistics as st

SAMPLE = [  # synthetic lines in the general style of tegrastats output (the format differs between releases: verify on yours)
    "RAM 3120/7620MB (lfb 4x4MB) CPU [45%@1420,60%@1420,38%@1420,41%@1420] GR3D_FREQ 62% cpu@52.5C gpu@50.0C",
    "RAM 3180/7620MB (lfb 4x4MB) CPU [52%@1420,71%@1420,44%@1420,49%@1420] GR3D_FREQ 78% cpu@54.0C gpu@52.0C",
    "RAM 3205/7620MB (lfb 3x4MB) CPU [48%@1420,66%@1420,40%@1420,43%@1420] GR3D_FREQ 71% cpu@55.5C gpu@53.0C",
]

def parse(line):
    ram = re.search(r"RAM (\d+)/(\d+)MB", line); cpu = re.search(r"CPU \[(.*?)\]", line); gpu = re.search(r"GR3D_FREQ (\d+)%", line)
    temps = [float(x) for x in re.findall(r"@(\d+\.?\d*)C", line)]
    return {"ram_used": int(ram.group(1)), "ram_total": int(ram.group(2)),
            "cpu": [int(x) for x in re.findall(r"(\d+)%@", cpu.group(1))] if cpu else [], "gpu": int(gpu.group(1)) if gpu else None, "tmax": max(temps) if temps else None}

rows = [parse(l) for l in SAMPLE]
cpu_peak = max(max(r["cpu"]) for r in rows); cpu_mean = st.mean(st.mean(r["cpu"]) for r in rows)
print(f"RAM peak {max(r['ram_used'] for r in rows)} MB of {rows[0]['ram_total']}; CPU peak core {cpu_peak}%, mean {cpu_mean:.0f}%; GPU peak {max(r['gpu'] for r in rows)}%; hottest sensor {max(r['tmax'] for r in rows)} C")
assert rows[0]["ram_total"] == 7620 and len(rows[0]["cpu"]) == 4 and max(r["gpu"] for r in rows) == 78 and abs(max(r["tmax"] for r in rows) - 55.5) < 1e-9
assert cpu_peak == 71 and 0.4 < max(r["ram_used"] for r in rows) / rows[0]["ram_total"] < 0.5 # a RAM headroom check for the compute budgetCommon engineering mistakes
Selecting by peak TOPS
Your pipeline’s bottleneck decides; measure it.
Benchmarking on a bench without enclosure and sun
Thermal throttling appears only in the real installation.
Forgetting the carrier board, heatsink and battery mass
The module is a fraction of the added mass.
Assuming the lowest power mode is the safe choice
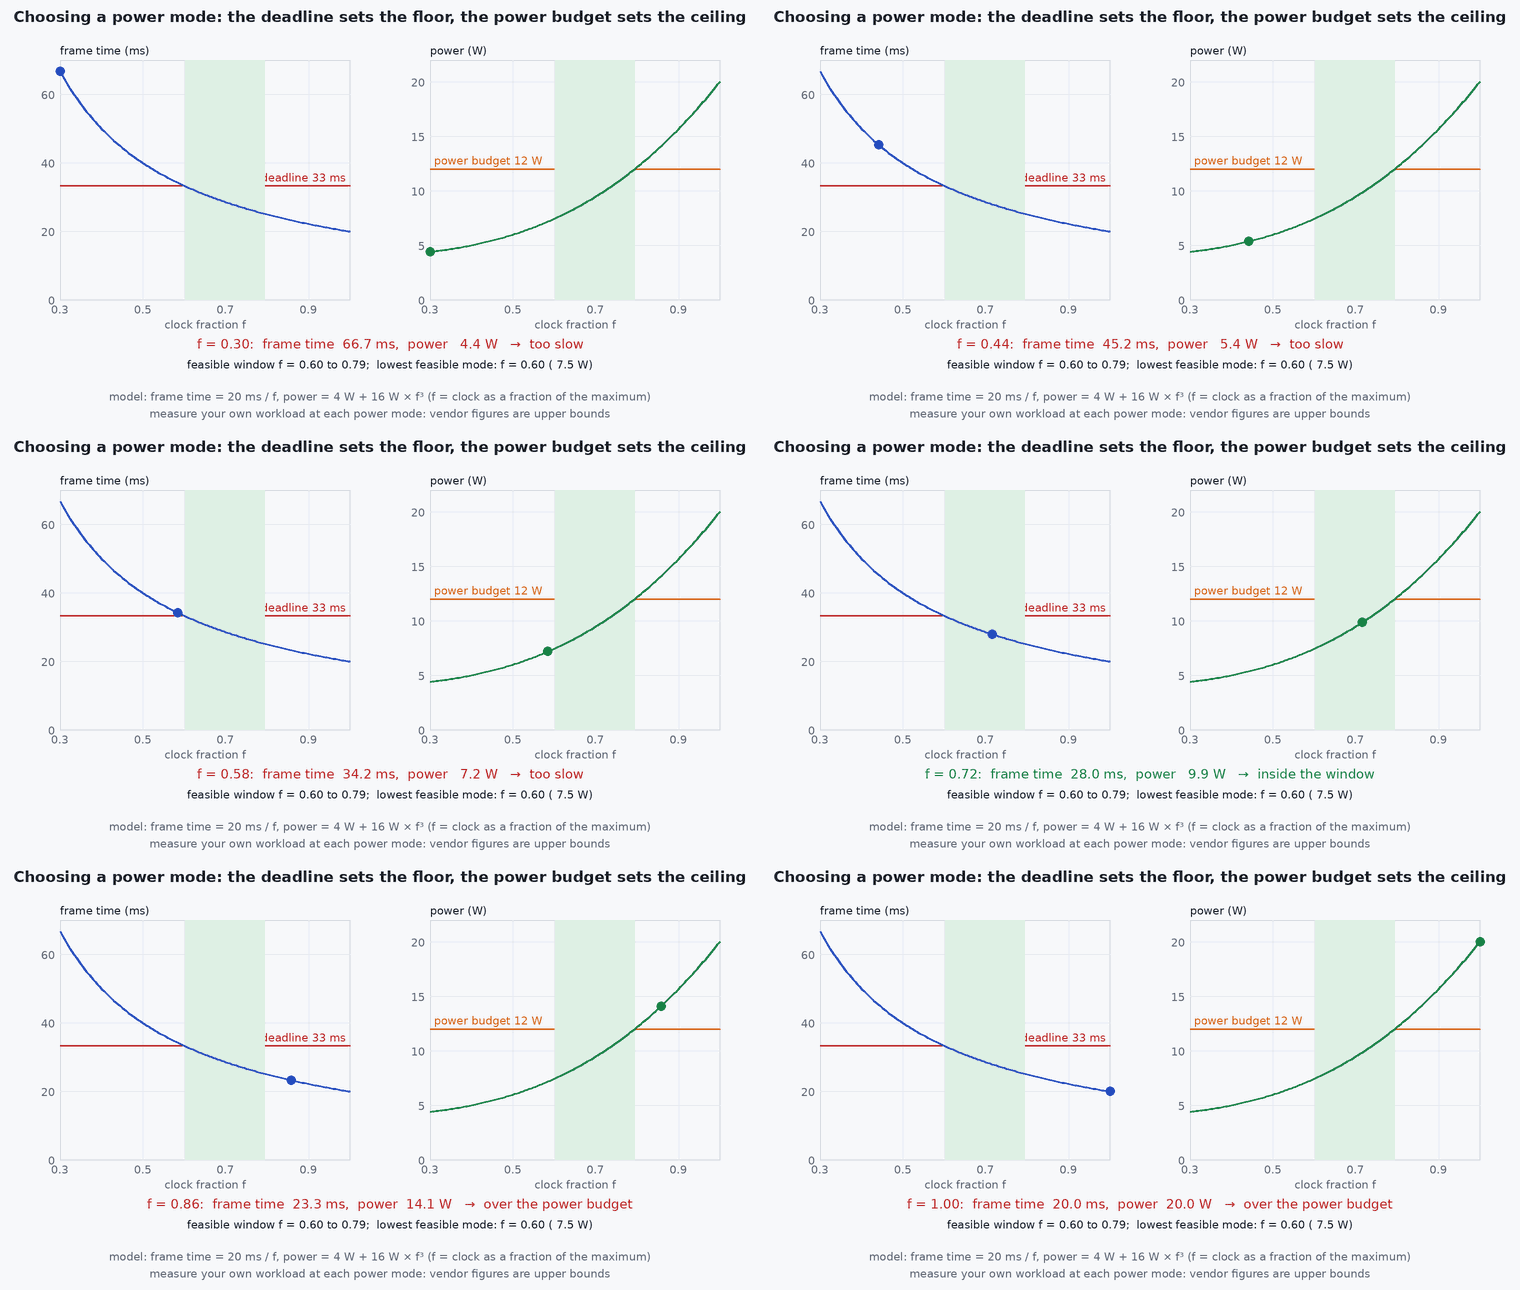
Too little compute raises latency and drops frames: pick the lowest mode that meets the deadline with margin.
Ignoring software support
The camera driver, LiDAR driver and JetPack version must match your pipeline.
Failure modes
| Failure mode | How it shows up | Likely cause |
|---|---|---|
| Thermal throttling | Frame rate falls after minutes in flight | Insufficient airflow, hot ambient, high mode |
| Out-of-memory kill | Process killed, pipeline stops | No memory budget; map growth |
| Dropped camera frames | Gaps in VIO input | CPU cores starved by other tasks or bus contention |
| Brown-out on boot | Reset at power-on | Inrush current exceeds the regulator |
Debugging approach
- Log tegrastats at 1 Hz throughout test flights with the full pipeline.
- Correlate frame drops with CPU, GPU and temperature.
- Run in the final enclosure at worst-case ambient.
- Compare latency percentiles in each power mode (lesson M7-T6).
Practical exercises
- Extend the parser to extract power rails if your tegrastats prints them.
- Estimate the flight-time cost of 15 and 250 for a 2 kg vehicle with 150 hover power.
- Compile the per-node CPU, GPU and RAM use of your own pipeline into a table.
- Define a pass criterion for “thermal margin” and a test that checks it.
Interview questions
Write an answer in your own words, then reveal the model answer. Nothing is sent anywhere.
Question 1
How would you choose an onboard computer for a perception pipeline?
Model answer
Measure the pipeline’s CPU, GPU and memory use, set the power and mass budgets, check I/O and software support, then verify on the target in the real enclosure at worst-case ambient, with margin; do not select on peak throughput.
Question 2
Why is throttling dangerous on a UAV?
Model answer
It silently lowers frame rate and raises latency in flight, degrading estimation exactly when the vehicle is committed.
Question 3
Which tools measure utilisation on Jetson?
Model answer
tegrastats for per-interval CPU, GPU, memory, temperature and power; nvpmodel to set the power mode; jetson_clocks to fix clocks for benchmarking.
References and further reading
Primary papers, official documentation and standards. Each claim above that is specific to a tool or version points here.