UAV Systems Engineering · Module 8
M8-T16: Technical risk assessment
A risk register is a decision tool: it says what to fix first, what to accept, and who accepted it.
You cannot remove every risk, so you must choose. A structured assessment turns hazards from the FMEA and fault trees into a ranked list with owners, mitigations and residual risk, and makes the acceptance of what remains an explicit decision. The method is simple; the discipline is in the scales, the evidence and the follow-up.
Learning objectives
After this lesson, you should be able to:
- Define consistent severity and likelihood scales for a UAV programme.
- Build a risk register with ranking that does not hide rare severe risks.
- Apply the mitigation hierarchy and estimate residual risk.
- Document acceptance with the authority who accepts it.
Conceptual explanation
Established Risk matrices and mitigation hierarchies are standard (for example in MIL-STD-882 and ISO 31000 style processes). The scale values below are examples for a research UAV and must be adapted to your programme, operating category and the regulations that apply.
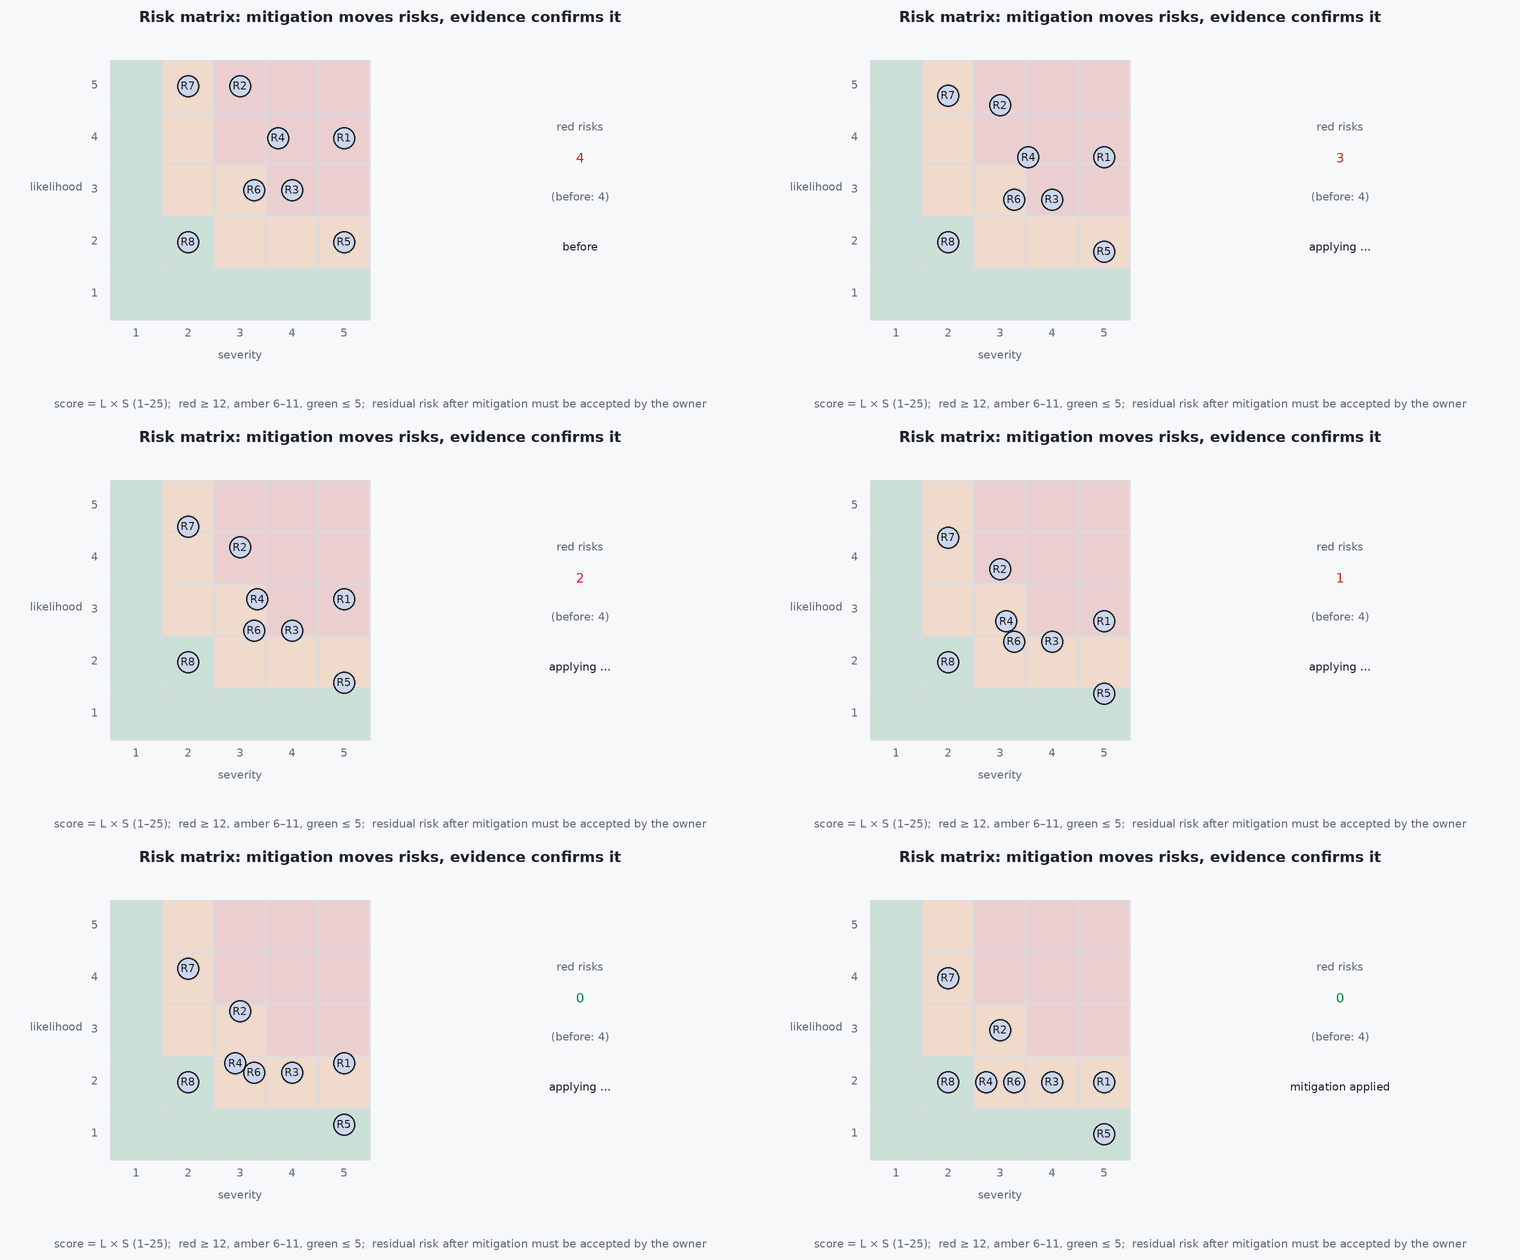
Severity describes the worst credible consequence; likelihood describes how often it is expected, over a stated exposure (per flight, per flight hour). A common five-by-five scale:
| Severity | Meaning (example) |
|---|---|
| 1 Negligible | Mission delayed; no damage |
| 2 Minor | Minor damage to the vehicle; no injury |
| 3 Major | Loss of vehicle; damage to property without injury |
| 4 Hazardous | Injury to a person; significant third-party damage |
| 5 Catastrophic | Serious injury or fatality |
| Likelihood | Meaning (example, per flight) |
|---|---|
| A Frequent | > 10⁻¹ |
| Probable | to |
| Occasional | to |
| Remote | to |
| Improbable | < 10⁻⁴ |
The mitigation hierarchy in order of effectiveness: eliminate the hazard (design it out: a prop guard, a safer site), reduce the likelihood (redundancy, monitors, procedures), reduce the severity (lower speed, frangible parts, a geofence, distance from people), then warnings and training. Procedures and training are the weakest because they depend on people not erring.
Engineering intuition
A matrix can mislead. Multiplying severity by likelihood treats a frequent nuisance and a rare catastrophe as equal if the products match. Rank by severity first, then likelihood: a catastrophic risk with an “improbable” rating still needs a justification for that rating and independent barriers. Also remember that likelihood estimates for new systems are judgement, with large uncertainty; test evidence and field data improve them, and the register should record the basis.
Risk acceptance belongs to someone with authority over the consequence, not to the engineer who is also late. A signed, dated acceptance with the conditions (“accepted for flights below 10 m/s over the test field only”) is what turns an engineering finding into an operational limit.
Mathematical formulation
Quantified risk for a hazard with per-flight probability and a consequence measure (expected loss) over flights is
For example a per-flight event probability of is % over a 200-flight campaign: “improbable per flight” is not improbable over a campaign. The evidence behind improves with data: the upper confidence bound after events in flights comes from the Clopper-Pearson interval, and for the rule of three gives (95 %), so 300 incident-free flights only support a claim of below , not . Likelihood classes for a hazard that depends on several independent barrier failures multiply: where is the effectiveness of barrier , which is why the barrier effectiveness must itself be verified (and why common cause between barriers erodes the product).
- event probability per flight.
- number of flights.
- consequence measure.
- effectiveness (probability of success) of barrier .
Architecture and data flow
FMEA and fault-tree outputs, incident reports and test findings → risk register (ID, hazard, cause, consequence, severity, likelihood with basis, mitigations, owner, residual severity and likelihood, status, acceptance record) in version control → ranking script → review board → decisions (accept, mitigate further, stop) recorded and linked to requirements and tests. Residual risks flow into the operational limitations and the briefing of every flight.
Real-world UAV applications
- Prioritising fixes before the first outdoor GNSS-denied flight.
- Deciding which risks to accept for a research campaign.
- Setting operational limits from residual risk.
- Reporting risk status to a review board.
Implementation example
This runs as shown. A risk register with severity-first ranking, residual risk after mitigations, campaign-level probabilities from the per-flight value, and the evidence check that flags likelihood claims that the number of flights cannot support. The entries are illustrative.
import math
LIK = {'A': 1e-1, 'B': 1e-2, 'C': 1e-3, 'D': 1e-4, 'E': 1e-5}                              # representative per-flight values for each class (example scale)
register = [
 dict(id='RK-1', hazard='VIO lost, undetected drift into a wall', sev=3, lik='C', mit='VO health monitor + fallback + pilot takeover', res_lik='D', basis='SIL: 100 % detection in 45 runs', flights_evidence=45),
 dict(id='RK-2', hazard='companion crash during offboard flight', sev=3, lik='B', mit='offboard loss failsafe: hold, tested', res_lik='D', basis='HIL + 10 flight tests', flights_evidence=10),
 dict(id='RK-3', hazard='vehicle strikes a person during a GNSS-denied flight', sev=5, lik='D', mit='site closed to persons; geofence; low speed', res_lik='E', basis='procedure and geofence test', flights_evidence=12),
 dict(id='RK-4', hazard='battery depletion before return', sev=3, lik='C', mit='energy-based return trigger', res_lik='D', basis='bench model + 6 flights', flights_evidence=6),
 dict(id='RK-5', hazard='mission delayed by calibration error', sev=1, lik='A', mit='pre-flight calibration check', res_lik='C', basis='field experience', flights_evidence=30)]
rank = sorted(register, key=lambda r: (-r['sev'], LIK[r['lik']] * -1))                    # severity first, then likelihood
print(f"{'id':>5} sev lik -> res   per-flight p (residual)   P(event in 200 flights)   evidence check")
for r in rank:
    p = LIK[r['res_lik']]; camp = 1 - (1 - p) ** 200; supported = 3 / r['flights_evidence'] <= p          # rule of three: can n flights support p?
    r['supported'] = supported
    print(f"{r['id']:>5} {r['sev']:>3} {r['lik']:>3} -> {r['res_lik']}      {p:8.0e}                  {camp:6.1%}                  {'OK' if supported else 'NOT SUPPORTED by ' + str(r['flights_evidence']) + ' flights (needs ' + str(math.ceil(3 / p)) + ')'}")
assert rank[0]['id'] == 'RK-3' and rank[-1]['id'] == 'RK-5'
unsupported = [r['id'] for r in rank if not r['supported']]; print("residual likelihood claims not supported by the evidence:", unsupported)
assert 'RK-3' in unsupported and abs((1 - (1 - 1e-3) ** 200) - 0.1814) < 1e-3Common engineering mistakes
Ranking by the product only
Rare catastrophic risks sink below frequent trivia; rank severity first.
Likelihood claims without evidence
State the basis; the number of flights limits what can be claimed.
Relying on procedures and training
They are the weakest mitigations; prefer design and monitors.
Accepting risk without authority
Acceptance needs the person accountable for the consequence, with conditions.
One-off register
Update after every flight campaign, incident and design change.
Failure modes
| Failure mode | How it shows up | Likely cause |
|---|---|---|
| Surprise hazard | Event not in the register | FMEA and fault tree not used as inputs |
| Overconfidence | Claimed “improbable” without data | No evidence basis recorded |
| Mitigation does not work | Barrier fails in the event | Effectiveness never verified |
| Stale register | Risks closed without verification | No review cycle |
Debugging approach
- Check each likelihood against the evidence in flights, hours and tests.
- Check that each mitigation has a verification test in the traceability matrix.
- Review the highest-severity rows with an independent reviewer.
- Recompute the campaign-level probabilities for the planned number of flights.
Practical exercises
- Build a register of eight risks for your GNSS-denied capstone and rank them.
- Compute the number of incident-free flights needed to support a per-flight probability of at 95 % confidence.
- Choose three mitigations for “vehicle strikes a person” and place them on the hierarchy.
- Write the acceptance statement for a residual risk with conditions.
Interview questions
Write an answer in your own words, then reveal the model answer. Nothing is sent anywhere.
Question 1
Why rank risks by severity first?
Model answer
A product of severity and likelihood can rate a rare catastrophic event the same as a frequent nuisance; ranking by severity first keeps catastrophic risks visible and demands independent barriers and evidence.
Question 2
How many flights support a claim of < 10⁻³?
Model answer
With zero events, about flights at 95 % confidence (rule of three); fewer flights support only a weaker claim, so other evidence (analysis, design barriers) must carry the argument.
Question 3
What is the mitigation hierarchy?
Model answer
Eliminate the hazard, reduce likelihood, reduce severity, then warnings, procedures and training; the later items depend more on human performance and are weaker.
References and further reading
Primary papers, official documentation and standards. Each claim above that is specific to a tool or version points here.